

Question: Carefully analyze for yourself the picture below ( it is regression output from STATA file ) . Provide detailed response and calculations for the following
Carefully analyze for yourself the picture belowit is regression output from STATA file Provide detailed response and calculations for the following task:
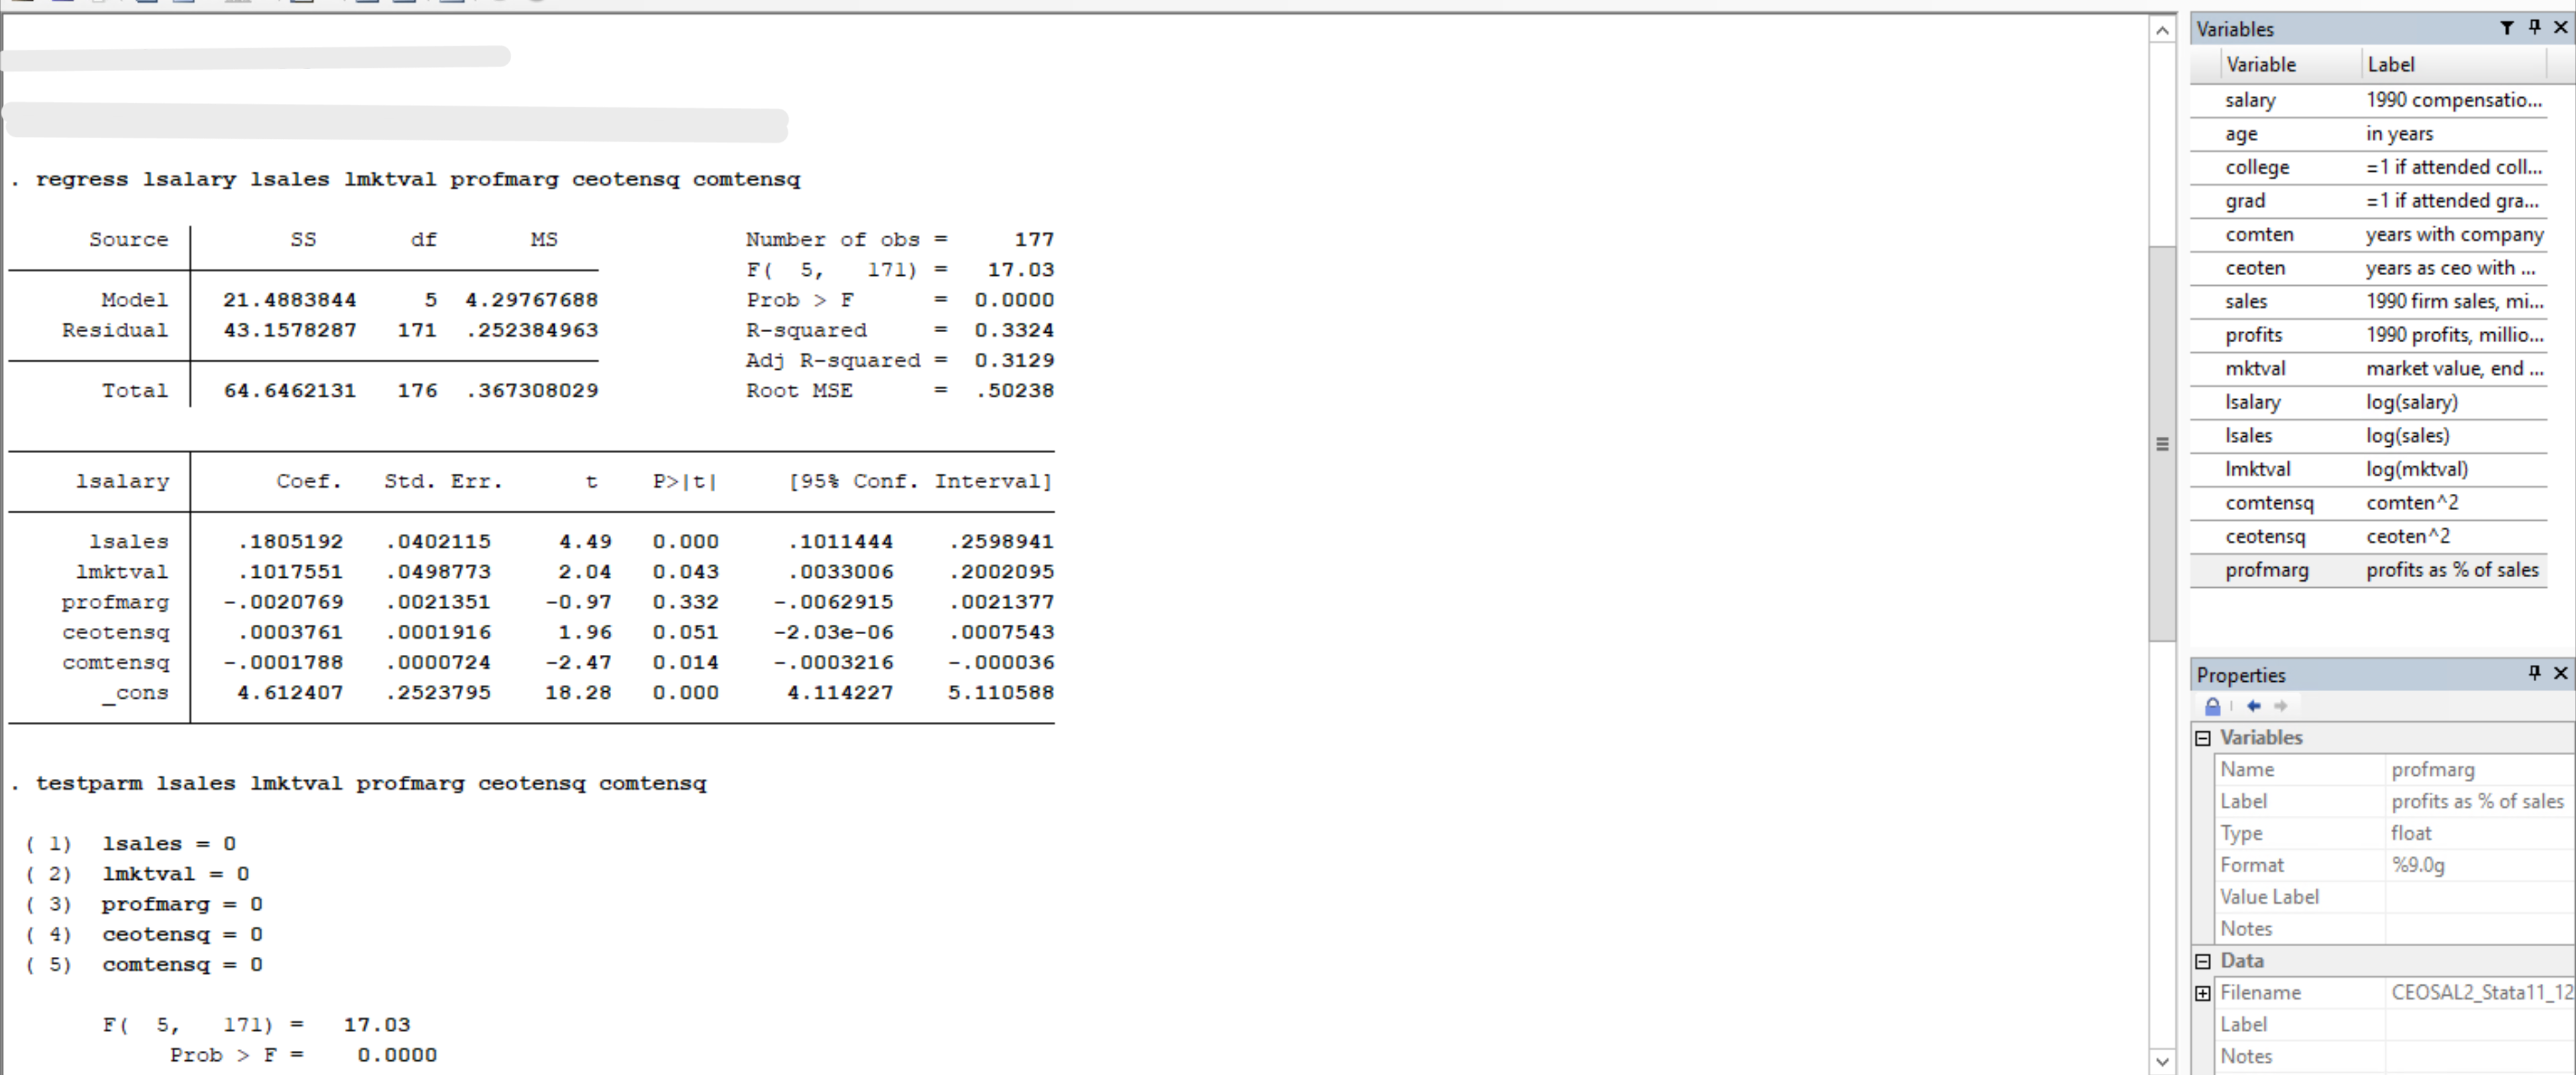
Consider an equation to explain log salaries of CEOs lsalary in terms of annual firms sales in logs lsales log of market value of the firm lmktval profits of the firm as a percentage of sales profmarg number of years as a CEO ceoten number of years in the company comten such that:
lsalary alpha beta lsales beta lmktval beta prof marg beta ceoten beta comten u
i Are the variables included in Model A intuitive as expected in terms of their signs? Explain why or why not? What do you make of the fact that longer tenure with the company, holding the other factors fixed, is associated with a lower salary?
regress lsalary lsales lmktval profmarg ceotensq comtensq
Number obs
Prob
squared
Adj squared
Root MSE
testparm lsales lmktval profmarg ceotensq comtensq
isales
lmktval
profmarg
ceotensq
comtensq
Prob
Step by Step Solution
There are 3 Steps involved in it
1 Expert Approved Answer
Step: 1 Unlock

Question Has Been Solved by an Expert!
Get step-by-step solutions from verified subject matter experts
Step: 2 Unlock
Step: 3 Unlock