

Question: Case Study #1 is intended to test your knowledge of how to summarize data using pivot tables in Excel using the data file, including
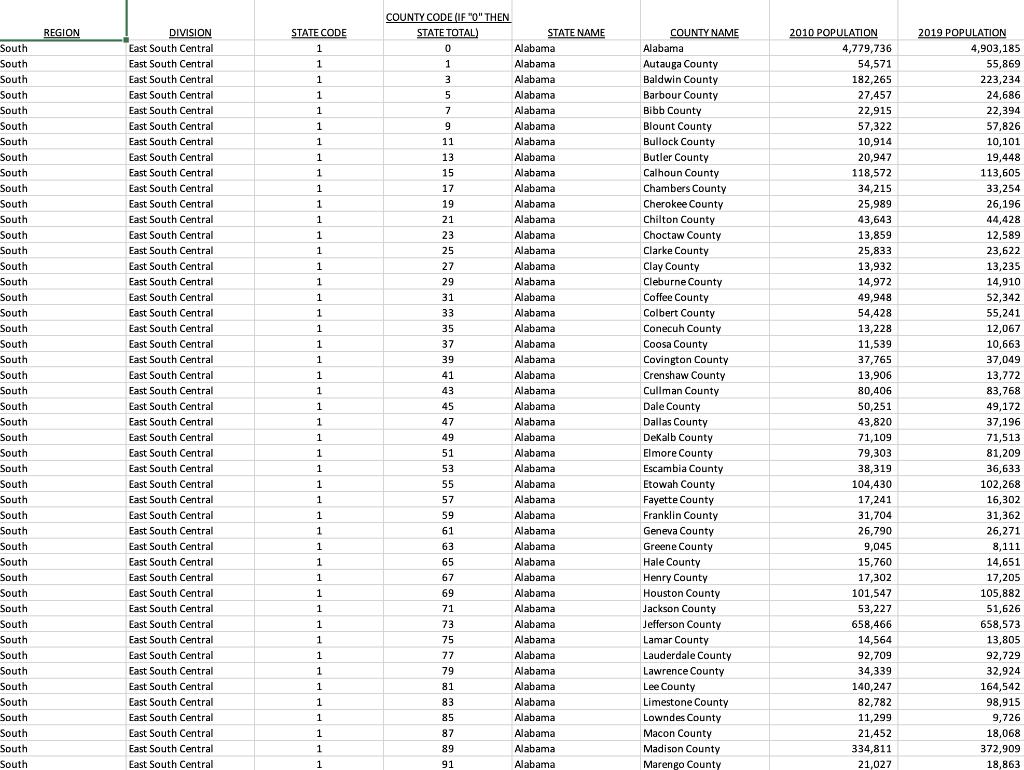
Case Study #1 is intended to test your knowledge of how to summarize data using pivot tables in Excel using the data file, including using filters and interpreting the results. The data file contains US Census Bureau (USCB) population counts for 2010 and 2019 for each of the 50 US states, along with the District of Columbia (DC), with both statewide totals and county level totals, as applicable. The data fields included are as follows: County Code - The USCB assigns a unique numeric code for each county within a state County Codes may be duplicated amongst different states o o County Code = 0 indicates total statewide population from all counties State Name . Region - Per the USCB the US is carved into distinct geographic regions Division - Each USCB Region is further carved into distinct geographic divisions State Code - The USCB assigns a unique numeric code for each state and DC . County Name 2010 Population - Population counts per the USCB for 2010 2019 Population - Estimated population counts per the USCB for 2019 After watching the video How to Create Pivot Tables in Excel (Links to an external site.), create the following 8 pivot tables: 1. 2 pivot tables - Total population and count of counties in 2010 and 2019 by Region 2. 2 pivot tables - Total population and count of counties in 2010 and 2019 by Division within each Region 3. 2 pivot tables - Total population and count of counties in 2010 and 2019 by State Name 4. Do the following for the state you currently reside in: a. 1 pivot table - Total population in 2010 and 2019 listed by County Name b. 1 pivot table - Pick another state to compare the previous pivot table results to and show both in one table (total population in 2010 and 2019 listed County Names) 5. Provide a brief summary noting the largest and smallest region/division/state from the first three steps and provide a brief summary explaining how the state you currently reside in compares to the other state you chose (# counties, total population counts in both 2010 and 2019, etc.). Summaries can be included in Excel in same worksheet(s) as each pivot table or in a separate worksheet. Submit a single workbook showing the 8 fully functional pivot tables and the requested summary information. South South South South South wwam South South C South w South South www South Sout South guany South South CATAL South Caval South South South South South South South South South South South wwwm South www South South Bodum South South South South South South South South wwwm South wwww South www South South www.m South South CATAL South South PEPE South South South South South South South South South REGION DIVISION East South Central East South Central East South Central East South Central East South Central East South Central Last Jouth centar East South Central East South Central Last Jouth centar East South Central doden c East South Central East South Central East South Central of East South Central East South Central East South Central Fart South Central East South Central Fast South Central East South Central East South Central East South Central East South Central East South Central East South Central East South Central Cast South Centra East South Central East South Central .. East South Central. East South Central East South Central East South Central East South Central East South Central East South Central East South Central South Centra East South Central. East South Central con East South Central East South Central East South Central. East South Central East South Central East South Central East South Central Central East South Central East South Central East South Central East South Central East South Central East South Central STATE CODE 1 1 1 2 1 1 1 + 1 1 1 1 1 1 1 1 1 1 1 1 1 1 1 1 1 3 1 2 1 + 1 1 1 1 1 1 1 1 + 1 2 1 3 1 2 1 1 1 1 1 1 1 1 1 1 1 1 1 1 1 1 COUNTY CODE (IF "0" THEN STATE TOTAL) 0 1 3 5 7 = 9 11 13 15 17 19 21 23 25 27 29 31 33 35 37 39 41 43 45 47 49 51 53 55 33 31 57 33 59 61 63 65 67 69 71 73 75 77 79 81 83 85 87 89 91 STATE NAME Alabama Alabama Alabama Alabama Alabama Aiguama Alabama Aiapane Alabama Alabama Navanna Alabama Alabama Alabama Alabama Alabama Mal Alabama Makame Alabama Mohame Alabama Alahama Alabama Alabama Alabama Alabama Alabama Atauania Alabama Navanna Alabama com Alabama Alabama Alabama Alabama Alabama Alabama Alabama Alabama Alabama Niavara Alabama Advana Alabama Cadeand Alabama Navanna Alabama ce Alabama Navama Alabama c Alabama Alabama www. Alabama Alabama Alabama Alabama Alabama Alabama Alabama Alabama COUNTY NAME Alabama Autauga County Baldwin County Barbour County Bibb County DIDE Blount County biodic county Bullock County Butler County Calhoun County Chambers County Lemone Cherokee County com Chilton County Choctaw County Clarke County C Clay County Cleburne Ca Cleburne County Coffee County Coffee County Colbert County Colbert County Conecuh County Coosa County Covington County Crenshaw County Cullman County Dale County Dallas County DeKalb County Elmore County Escambia County Etowah County Fayette County Franklin County Geneva County Geneva County Greene County oreanc Hale County Henry County Houston County F Jackson County Jefferson County Darrere Lamar County Lauderdale County Lawrence County Lee County Limestone County Lowndes County Macon County Madison County Marengo County 2010 POPULATION 4,779,736 54,571 182,265 27,457 47,957 22,915 57,322 10,914 30.017 20,947 118,572 www 34,215 wwwww 25.989 comer 43,643 13,859 25,833 13,932 14.072 14,972 48 949 49,948 54 428 54,428 13.228 11,539 37,765 15,900 13,906 80,406 wwwwww 50,251 262 43,820 71,109 79,303 38,319 104,430 17,241 31,704 31,704 26,790 9,045 15,760 17,302 www. 101,547 EVATORI 53,227 658,466 14,564 92,709 MO 34,339 140 247 140,247 82 782 11,299 21,452 334,811 21,027 2019 POPULATION 4,903,185 55,869 223,234 24,686 22,394 57,826 10,101 19,448 113,605 ***** 33,254 26,196 were 44,428 12,589 23,622 12 225 13,235 14.010 14,910 52,342 55,241 12,067 10,663 57,049 37,049 13,772 2017 83,768 49,172 37,196 71,513 81,209 36,633 102,268 16,302 10,302 31,362 51,302 26,271 Ever 8,111 14,651 17,205 1,200 105,882 51,626 658,573 13,805 92,729 13.014 32,924 164,542 00 017 98,915 9,726 18,068 372,909 18,863
Step by Step Solution
3.36 Rating (149 Votes )
There are 3 Steps involved in it
Because national definitions of urban and rural areas differ significantly from one country to another it is difficult to compare these areas across national borders If we cant compare the performance ... View full answer

Get step-by-step solutions from verified subject matter experts