Question: CASE STUDY #2: FORECASTING COMPUTER SALES AT THE UNIVERSITY BOOKSTORE The bookstore at the North Point University is owned and operated by the university through
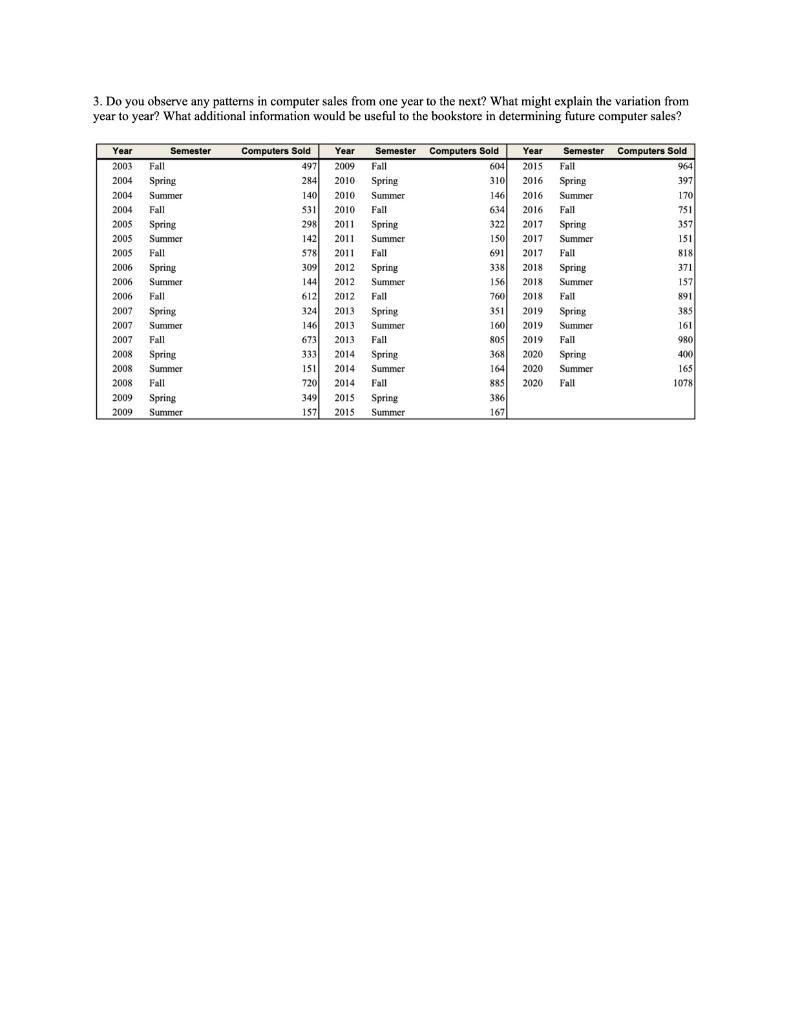
CASE STUDY #2: FORECASTING COMPUTER SALES AT THE UNIVERSITY BOOKSTORE The bookstore at the North Point University is owned and operated by the university through an independent corporation with its own board of directors. The bookstore has three locations on or near the university campus. It stocks a range of items, including textbooks, trade books, logo apparel, drawing and educational supplies, and computers and related products such as printers, mice, and software. The bookstore has a program to sell laptopotebook computers to incoming first-year students and other students at a substantial educational discount partly passed on from n computer manufacturers. This means that the bookstore just covers computer costs with a very small profit margin remaining, The university has new students starting each semester; however, the fall intake is the largest. Each summer all incoming first-year students and their parents come to the university campus for a three-day orientation program. The students come in groups of 100 throughout the summer. During their visit the students and their parents are given details about the bookstore's computer purchase program. Some students place their computer orders for the fall semester at this time, while others wait until later in the summer. The bookstore also receives orders from returning students throughout the summer. This program presents a challenging supply chain management problem for the bookstore. Orders come in throughout the summer, many only a few weeks before school starts in the fall, and the computer suppliers require at least six weeks for delivery. Thus, the bookstore must forecast computer demand to build up inventory to meet student demand in the fall. The student computer program and the forecast of computer demand have repercussions all along the bookstore supply chain. The bookstore has a warehouse near campus where it must store all computers since it has no storage space at its retail locations. Ordering too many computers not only ties up the bookstore's cash reserves, but also takes up limited storage space limits inventories for other bookstore products during the bookstore's busiest sales period. Since the bookstore has such a low profit margin on computers, its bottom line depends on these other products. As competition for good students has increased, the university has become very quality-conscious and insists that all university facilities provide exemplary student service, which for the bookstore means meeting all student demands for computers when the fall semester starts. The number of computers ordered also affects the number of temporary warehouse and bookstore workers that must be hired for handling and assisting with computer setups and installations. The number of truck trips from the warehouse to the bookstore each day of fall registration is also affected by computer sales, The same process is repeated for the spring and summer semesters as well, although the volume of sales is much smaller. The bookstore student computer purchase program has been in place since 2003. In this time, the student population has grown, and the academic and economic profile of the students has shifted. Historical data on computer sales have been collected; refer to the table on the following page (spreadsheet available on Blackboard). Assignment Develop an appropriate model for bookstore management to use to forecast computer demand for the next academic year (fall, spring, and summer) and indicate how accurate it appears to be. 1. Use each forecasting technique listed below. . Moving average . Exponential smoothing Linear regression (with time period as the independent variable) Evaluate the accuracy of each method using the MSE, MAE and MAPE. Through trial and error, determine the best forecasting technique within each category and the best overall technique. In other words, you will need to experiment with different moving averages and different values of smoothing parameter a. Suggestion: Do not do this by hand! Use Excel and show results for different forecasting techniques. 2. Using the best techniques identified above, what is your forecast for computer sales the next year? 3. Do you observe any patterns in computer sales from one year to the next? What might explain the variation from year to year? What additional information would be useful to the bookstore in determining future computer sales? Year Semester 2003 Fall 2004 Spring 2004 Summer 2004 Fall 2005 Spring 2005 Summer 2005 Fall 2006 Spring 2006 Suramer 2006 Fall 2007 Spring 2007 Summer 2007 Fall 2008 Spring 2008 Summer 2008 Fall 2009 Spring 2009 Summer Computers Sold 4971 2841 140 531 298 142 $78 309 144 612 324 146 673 Year Semester Computers Sold 2009 Fall 604 2010 Spring 310 2010 Summer 140 2010 Fall 634 2011 Spring 322 2011 Summer 150 2011 Fall 691 2012 Spring 338 2012 Summer 156 2012 Fall 760 2013 Spring 351 2013 Summer 166 2013 Fall 80S 2014 Spring 368 2014 Summer 164 2014 Fall 885 2015 Spring 386 2015 Summer 1671 Year 2015 2016 2016 2016 2017 2017 2017 2018 2018 2018 2019 2019 2019 2020 2020 2020 Semester Computers Sold Fall 964 Spring 397 Summer 170 Fall 751 Spring 357 Summer 151 Fall 818 Spring 371 Summer 157 Fall 891 Spring 385 Summer 161 Fall 980 Spring 400 Summer 165 Fall 1078 151 720 349 1571


