

Question: CASE STUDY Financial Statements for Walmart Stores Inc. and Macy's Inc. Table 3 - 8 contains the financial results for Walmart and Macy's for 2
CASE STUDY
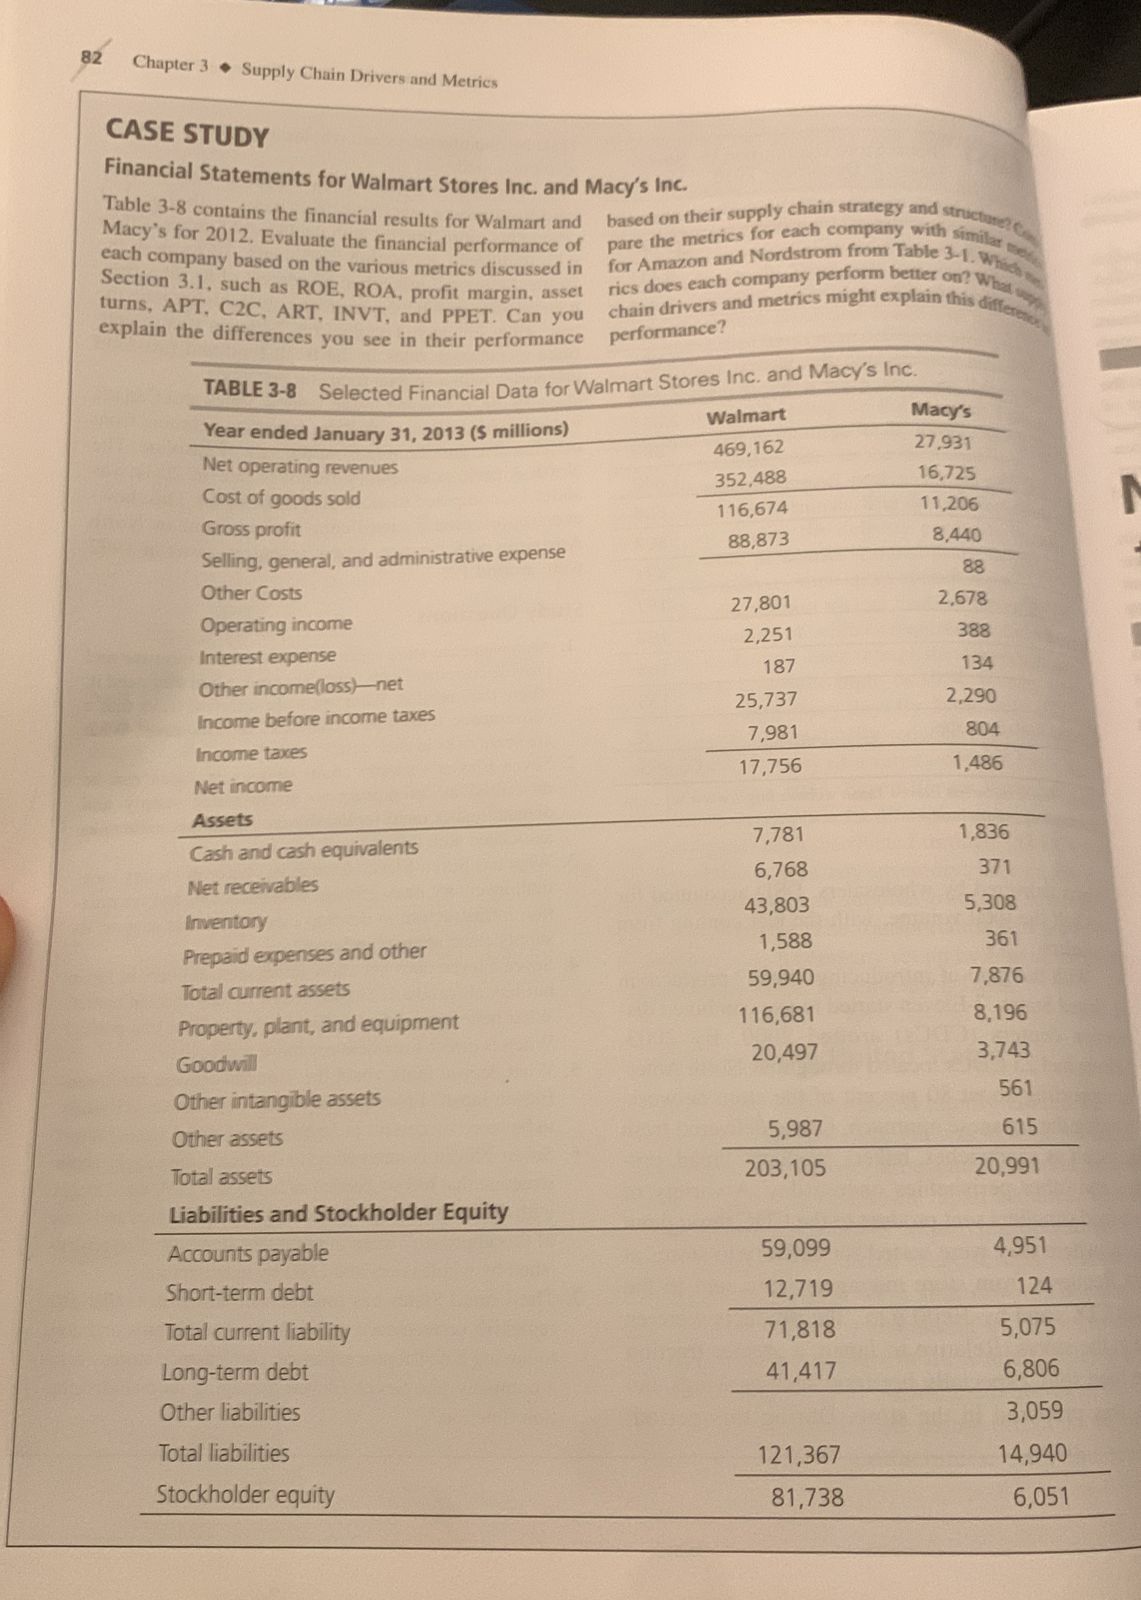
Financial Statements for Walmart Stores Inc. and Macy's Inc.
Table contains the financial results for Walmart and
Macy's for Evaluate the financial performance of
each company based on the various metrics discussed in
Section such as ROE, ROA, profit margin, asset
turns, APT, CC ART, INVT, and PPET. Can you
explain the differences you see in their performance
based on their supply chain strategy and strictiote?
rics does each company perform better on What
chain drivers and metries might explain this differ
performance?
TABLE Selected Financial Data for Walmart Stores Inc. and Macy's Inc.
Step by Step Solution
There are 3 Steps involved in it
1 Expert Approved Answer
Step: 1 Unlock

Question Has Been Solved by an Expert!
Get step-by-step solutions from verified subject matter experts
Step: 2 Unlock
Step: 3 Unlock