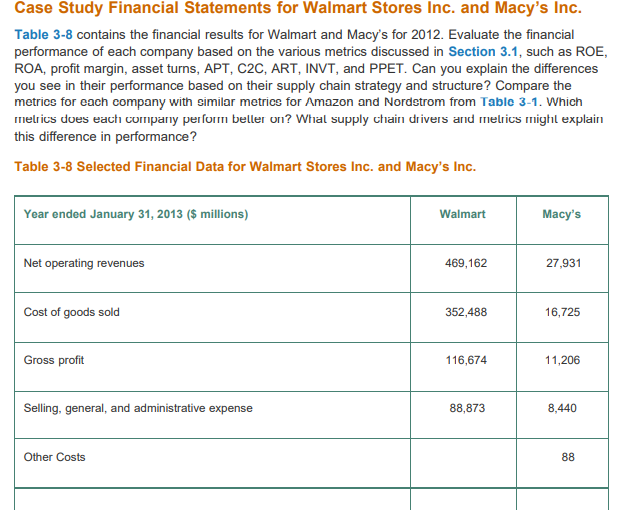
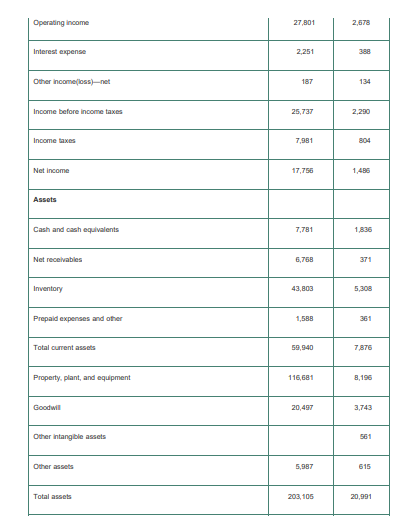
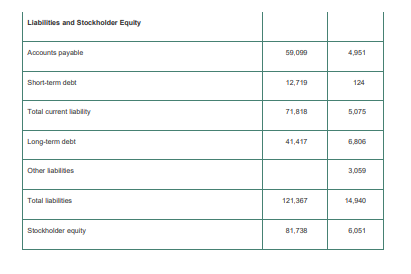
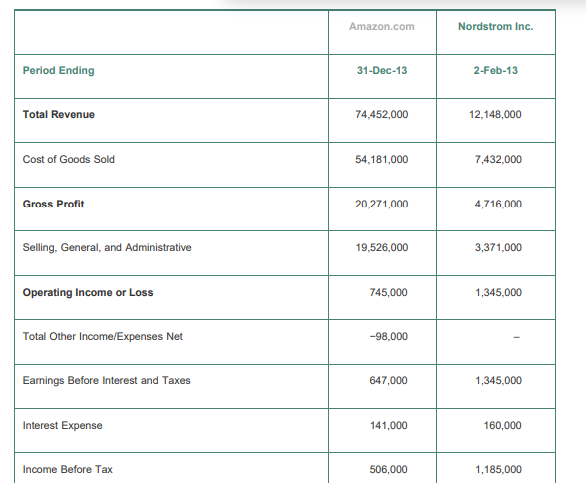
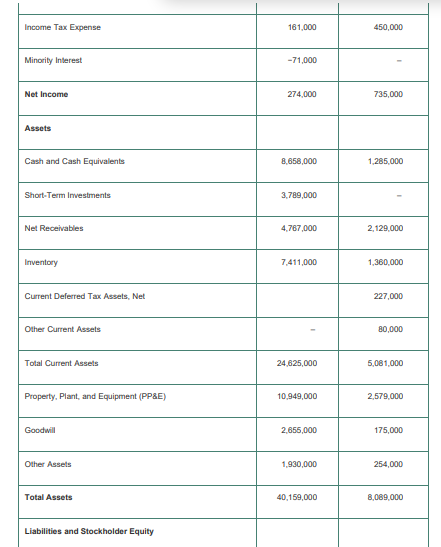
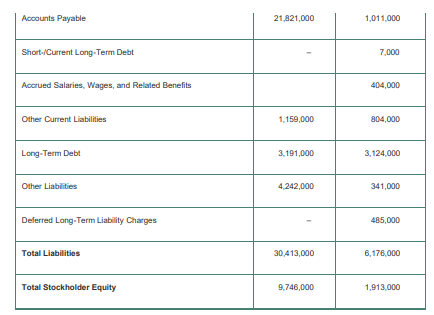
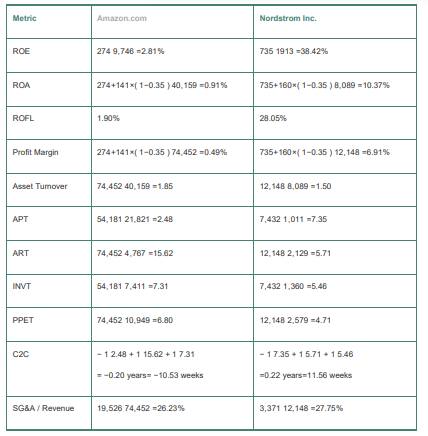
Case Study Financial Statements for Walmart Stores Inc. and Macy's Inc. Table 3-8 contains the financial results for Walmart and Macy's for 2012. Evaluate the financial performance of each company based on the various metrics discussed in Section 3.1, such as ROE, ROA, profit margin, asset turns, APT, C2C, ART, INVT, and PPET. Can you explain the differences you see in their performance based on their supply chain strategy and structure? Compare the metrics for each company with similar metrics for Amazon and Nordstrom from Table 3-1. Which melrics dues each company perform beller on? Whial supply chain drivers and meltics mighl explain this difference in performance? Table 3-8 Selected Financial Data for Walmart Stores Inc. and Macy's Inc. Year ended January 31, 2013 ($ millions) Walmart Macy's Net operating revenues 469,162 27,931 Cost of goods sold 352,488 16,725 Gross profit 116,674 11,206 Selling, general, and administrative expense 88,873 8,440 Other Costs 88 Operating income 27,801 2,678 Interest expense 2.251 388 Other Income loss) et 187 134 Income before income taxes 25,737 2,290 Income taxes 7,981 804 Net Income 17,756 1,485 Assets Cash and cash equivalents 7,781 1,836 Net receivables 6,758 371 Inventory 43,803 5,308 Prepaid expenses and other 1,500 361 Total current assets 50,940 7,876 Property, plant, and equipment 116,681 8,196 Goodwill 20,497 3,743 Other intangible assets 561 Other assets 5,987 615 Total assets 203, 105 20,991 Liabilities and Stockholder Equity Accounts payable 59,099 4,951 Short-term debt 12,719 124 Total current ability 71,818 5,075 Long-term debt 41,417 6,805 Other labides 3,059 Total abilities 121,367 14,940 Stockholder equity 81,738 6,051 Amazon.com Nordstrom Inc. Period Ending 31-Dec-13 2-Feb-13 Total Revenue 74,452,000 12, 148,000 Cost of Goods Sold 54,181,000 7,432,000 Gross Profit 20,271,000 4.716.000 Selling, General, and Administrative 19,526,000 3,371,000 Operating Income or Loss 745,000 1,345,000 Total Other Income/Expenses Net -98,000 Earnings Before Interest and Taxes 647,000 1,345,000 Interest Expense 141,000 160,000 Income Before Tax 506,000 1,185,000 Income Tax Expense 161,000 450,000 Minority interest -71,000 Net Income 274,000 735,000 Assets Cash and Cash Equivalents 8,658,000 1,285.000 Short-Term Investments 3,789,000 Net Receivables 4.767,000 2,129,000 Inventory 7.411,000 1,360.000 Current Deferred Tax Assets, Net 227,000 Other Current Assets 80,000 Total Current Assets 24.625,000 5,081,000 Property, Plant, and Equipment (PP&E) 10.949,000 2.579.000 Goodwill 2,655,000 175,000 Other Assets 1.930,000 254,000 Total Assets 40,159,000 8,089,000 Liabilities and Stockholder Equity Accounts Payable 21.821,000 1,011,000 Short-Current Long-Term Debt 7,000 Accrued Salaries, Wages, and Related Benefits 404,000 Other Current Liabilities 1.159,000 804,000 Long-Term Debt 3.191,000 3,124,000 Other Liabilities 4,242,000 341,000 Deferred Long-Term Liability Charges 485,000 Total Liabilities 30,413,000 6.176.000 Total Stockholder Equity 9,746,000 1,913,000 Metric Amazon.com Nordstrom Inc. ROE 274 9,746 -2.81% 735 1913 -38.42% ROA 274+141 (1-0.35 ) 40,159 -0.91% 735+160 1-0.35 ) 8,089 = 10.37% ROFL 1.90% 28.05% Profit Margin 274+141(1-0.35 ) 74,452 -0.49% 735+160M 1-0.35 ) 12,148 -6.91% Asset Tumover 74.452 40,159 -1.85 12.148 8,089 -1.50 APT 54,181 21,821 =2.48 7,432 1,011 =7.35 ART 74.452 4.787 =15.62 12.148 2.129 -5.71 INVT 54,181 7,411 =7.31 7,432 1,360 -5.48 PPET 74,452 10,949 -6.80 12,148 2,579 -4.71 C2C - 12.48 + 1 15.62+1 7.31 = -0.20 years -10.53 weeks - 17.35 + 15.71 + 1 5.46 =0 22 years=11.58 weeks SG&A / Revenue 19,528 74,452 -26.23% 3,371 12,148 = 27.75%


