

Question: The data in Table below represent individual observations on molecular Weight taken hourly from a chemical process. The target value for the molecular weight is

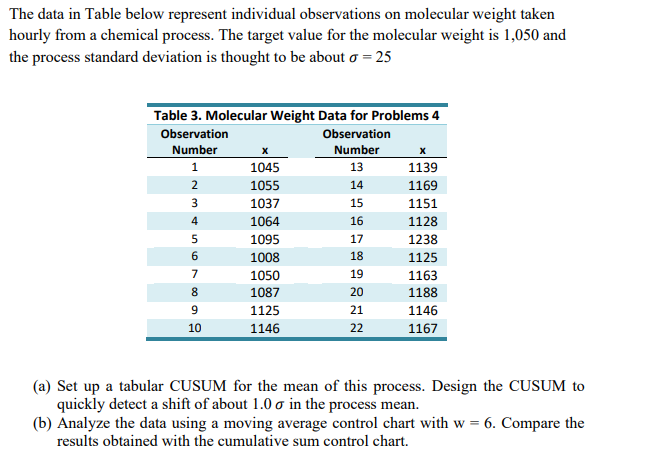
The data in Table below represent individual observations on molecular Weight taken hourly from a chemical process. The target value for the molecular weight is 1,351} and the process standard deviation is thought to be about ct = 25 Table 3. Molecular 1i'lleight: Data for Problem 4 observation Observation lumber a Number it 1 1045 13 1133 2 1(155 13 1169 3 133? 15 1151 d 1054 16 1123 5 1095 1? 12 33 E 1033 13 1125 T" 1353 19 1153 3 1332 20 1133 9 1 125 21 1145 10 1 143 22 1132 {a} Set up a tabular CUSUM for the mean of this process. Design the CUSUM to quickly detect a shift of about LG {I in the process mean. {b} Analyze the data using a moving average control chart with w = 6. Compare the results obtained with the cumulative sum control chart
Step by Step Solution
There are 3 Steps involved in it

Get step-by-step solutions from verified subject matter experts