

Question: chart below depicts the beverage size ers choose while at a fast food ant. Complete parts (a) through (c). pular beverage sizes at a
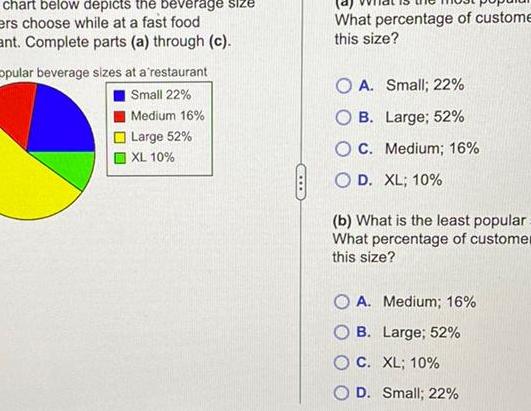
chart below depicts the beverage size ers choose while at a fast food ant. Complete parts (a) through (c). pular beverage sizes at a restaurant Small 22% Medium 16% Large 52% XL 10% What percentage of custome this size? OA. Small; 22% OB. Large; 52% OC. Medium; 16% OD. XL; 10% (b) What is the least popular What percentage of customer this size? OA. Medium; 16% B. Large; 52% OC. XL; 10% D. Small; 22%
Step by Step Solution
There are 3 Steps involved in it
1 Expert Approved Answer
Step: 1 Unlock

Question Has Been Solved by an Expert!
Get step-by-step solutions from verified subject matter experts
Step: 2 Unlock
Step: 3 Unlock