

Question: Check different sheets on this workbook. In the Dashboard and Reasoning sheet, create a dashboard that shows a summary of the companys financial statement. Compare
Check different sheets on this workbook. In the Dashboard and Reasoning sheet, create a dashboard that shows a summary of the companys financial statement. Compare the data provided on Retained Earning, Intangible and Goodwill and Income Statement sheets between the years of 2011 to 2020 and explain the best and the worst years for the company. Use at least one chart (choose the best chart type) to help you with the illustration. Write two paragraphs about the best and the worst years and explain your reasons as a business data analyst. Your two paragraphs together should not be less than 200 words. 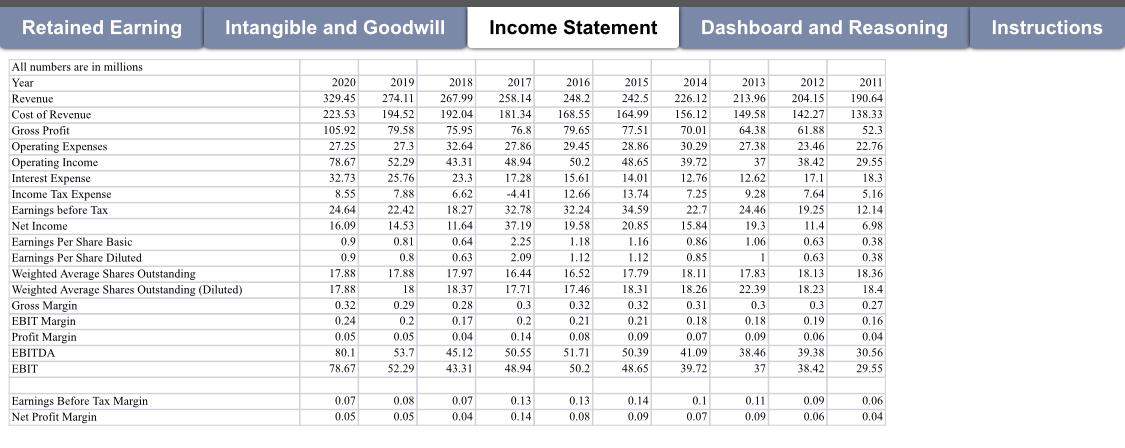
Retained Earning Intangible and Goodwill Income Statement Dashboard and Reasoning Instructions 2013 213.96 149.58 64.38 All numbers are in millions Year Revenue Cost of Revenue Gross Profit Operating Expenses Operating Income Interest Expense Income Tax Expense Earnings before Tax Net Income Earnings Per Share Basic Earnings Per Share Diluted Weighted Average Shares Outstanding Weighted Average Shares Outstanding (Diluted) Gross Margin EBIT Margin Profit Margin EBITDA EBIT 2020 329.45 223.53 105.92 27.25 70 78.67 32.73 Des 8.55 24.64 2 16.09 0.9 0.9 17.88 17.88 0.32 0.24 0.05 80.1 78.67 2019 274.11 194.52 79.58 272 27.3 5220 52.29 25 25.76 7.88 22.42 14 52 14.53 0.81 0.8 17.88 19 18 0.29 0.2 0.05 53.7 52.29 2018 267.99 192.04 75.95 32.64 422 43.31 23.3 600 6.62 18.27 11.64 we 0.64 62 0.63 1707 17.97 18.37 0.28 0.17 0,04 45.12 43.31 2017 258.14 181.34 za 76.8 27.86 48.94 1778 17.28 -4.41 2978 32.78 27.10 37.19 205 2.25 2.09 16.44 16.44 17.71 0.3 0.2 0.14 50.55 48.94 2016 248.2 168.55 79.65 29.45 30 50.2 15 15.61 12.66 22 32.24 10 58 19.58 119 1.18 112 1.12 16.52 17.46 0.32 0.21 0.08 51.71 50.2 2015 242.5 164.99 77.51 77 61 30 28.86 ce 48.65 14.01 12 13.74 34.59 24 50 200 20.85 1.16 1.12 17.79 18.31 0.32 0.21 0.09 50.39 48.65 2014 226.12 156.12 70.01 30.29 204 39.72 12.76 23 7.25 22.7 15 15.84 0.86 noc 0.85 18 18.11 18.26 0.31 0.18 0.07 41.09 27.38 37 12.62 9.28 24.46 19.3 1.06 1 17.83 22.39 0.3 0.18 0.09 38.46 37 37 2012 204.15 142.27 61.88 7240 23.46 20 38.42 12 17.1 77 7.64 10 19.25 11.4 0.63 0.63 1813 18.13 18.23 0.3 0.19 0.19 0.06 39.38 38.42 2011 190.64 138.33 52.3 22.76 29.55 20 55 10 18.3 5.16 19 12.14 00 6.98 20 0.38 020 0.38 18.36 18.4 18 10.4 0.27 0.16 0.04 30.56 29.55 39.72 Earnings Before Tax Margin Net Profit Margin 0.07 0.05 0.08 0.05 0.07 0.04 0.13 0.14 0.13 0.08 0.14 0.09 0.1 0.07 0.11 0.09 0.09 0.06 0.06 0.04 Retained Earning Intangible and Goodwill Income Statement Dashboard and Reasoning Instructions 2013 213.96 149.58 64.38 All numbers are in millions Year Revenue Cost of Revenue Gross Profit Operating Expenses Operating Income Interest Expense Income Tax Expense Earnings before Tax Net Income Earnings Per Share Basic Earnings Per Share Diluted Weighted Average Shares Outstanding Weighted Average Shares Outstanding (Diluted) Gross Margin EBIT Margin Profit Margin EBITDA EBIT 2020 329.45 223.53 105.92 27.25 70 78.67 32.73 Des 8.55 24.64 2 16.09 0.9 0.9 17.88 17.88 0.32 0.24 0.05 80.1 78.67 2019 274.11 194.52 79.58 272 27.3 5220 52.29 25 25.76 7.88 22.42 14 52 14.53 0.81 0.8 17.88 19 18 0.29 0.2 0.05 53.7 52.29 2018 267.99 192.04 75.95 32.64 422 43.31 23.3 600 6.62 18.27 11.64 we 0.64 62 0.63 1707 17.97 18.37 0.28 0.17 0,04 45.12 43.31 2017 258.14 181.34 za 76.8 27.86 48.94 1778 17.28 -4.41 2978 32.78 27.10 37.19 205 2.25 2.09 16.44 16.44 17.71 0.3 0.2 0.14 50.55 48.94 2016 248.2 168.55 79.65 29.45 30 50.2 15 15.61 12.66 22 32.24 10 58 19.58 119 1.18 112 1.12 16.52 17.46 0.32 0.21 0.08 51.71 50.2 2015 242.5 164.99 77.51 77 61 30 28.86 ce 48.65 14.01 12 13.74 34.59 24 50 200 20.85 1.16 1.12 17.79 18.31 0.32 0.21 0.09 50.39 48.65 2014 226.12 156.12 70.01 30.29 204 39.72 12.76 23 7.25 22.7 15 15.84 0.86 noc 0.85 18 18.11 18.26 0.31 0.18 0.07 41.09 27.38 37 12.62 9.28 24.46 19.3 1.06 1 17.83 22.39 0.3 0.18 0.09 38.46 37 37 2012 204.15 142.27 61.88 7240 23.46 20 38.42 12 17.1 77 7.64 10 19.25 11.4 0.63 0.63 1813 18.13 18.23 0.3 0.19 0.19 0.06 39.38 38.42 2011 190.64 138.33 52.3 22.76 29.55 20 55 10 18.3 5.16 19 12.14 00 6.98 20 0.38 020 0.38 18.36 18.4 18 10.4 0.27 0.16 0.04 30.56 29.55 39.72 Earnings Before Tax Margin Net Profit Margin 0.07 0.05 0.08 0.05 0.07 0.04 0.13 0.14 0.13 0.08 0.14 0.09 0.1 0.07 0.11 0.09 0.09 0.06 0.06 0.04
Step by Step Solution
There are 3 Steps involved in it

Get step-by-step solutions from verified subject matter experts