

Question: Project2 Check different sheets on this workbook. In the Dashboard and Reasoning sheet, create a dashboard that shows a summary of the company's financial statement.
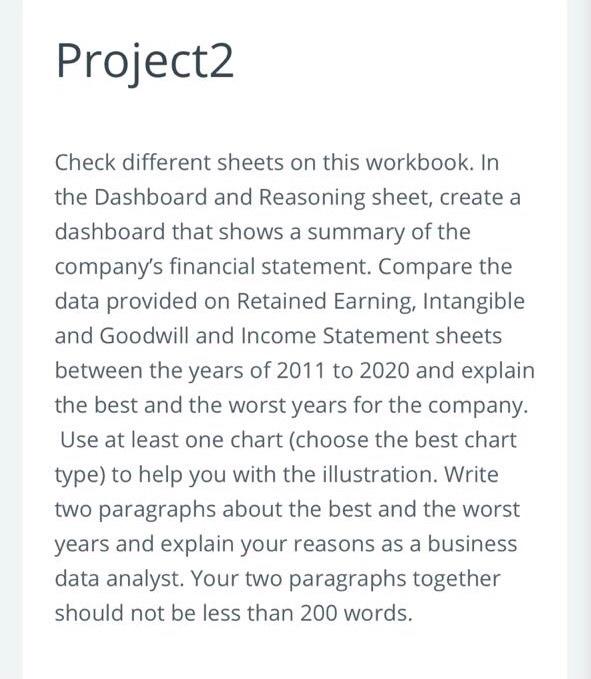
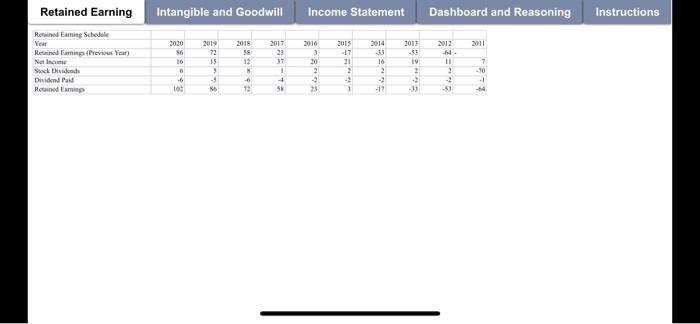
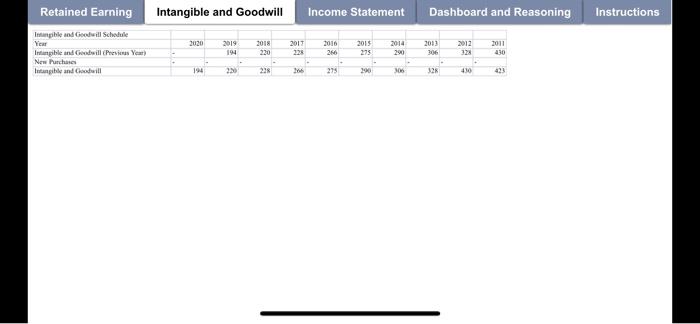
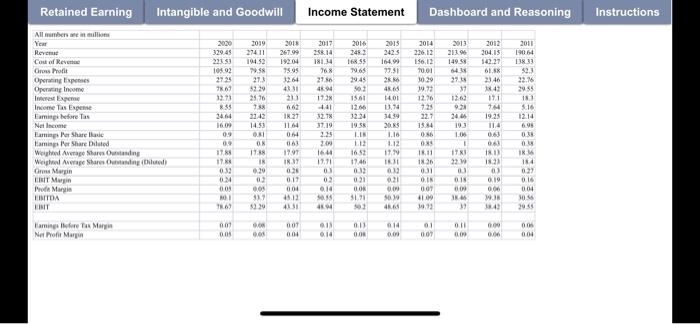
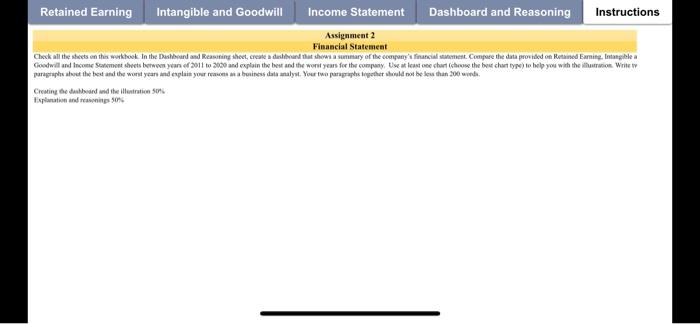
Project2 Check different sheets on this workbook. In the Dashboard and Reasoning sheet, create a dashboard that shows a summary of the company's financial statement. Compare the data provided on Retained Earning, Intangible and Goodwill and Income Statement sheets between the years of 2011 to 2020 and explain the best and the worst years for the company. Use at least one chart (choose the best chart type) to help you with the illustration. Write two paragraphs about the best and the worst years and explain your reasons as a business data analyst. Your two paragraphs together should not be less than 200 words. Retained Earning Intangible and Goodwill Income Statement Dashboard and Reasoning Instructions 2015 2012 2011 2030 56 Red Eaming Schedule Year Retained Esminga (Previous Year) Net Income Sock Dividends Dividend Paid Hemed lamp 2019 72 15 2018 55 12 2017 23 37 2016 3 30 2 2014 33 16 2 2013 -33 19 2 21 11 2 6 6 to 7 -70 1 44 -4 -6 Ta + 58 * - 13 Intangible and Goodwill Income Statement Dashboard and Reasoning Instructions Retained Earning Intangible and will Schedule Intangible and Goodwill Preven Year) Now Purchase Intangible and will 2020 2019 2013 2012 2018 230 2016 266 - 27 2015 275 2014 290 2011 130 194 230 238 200 306 328 430 423 Retained Earning Intangible and Goodwill Income Statement Dashboard and Reasoning Instructions 110Z 2015 2425 All members in mu Yew Reven Cost of Revenue Cross Profit Operating Tips Operaeng Income 2012 204.15 2000 329.45 221 53 10892 2725 2019 27411 194.52 7.58 273 2018 267.99 19204 7595 2016 248.2 1685 N65 2013 213.9 149 58 99.51 2.6 61 23:46 27 767 19 E IT 4. 143 14.01 25.76 788 1373 235 3464 16.00 0.9 162 18.27 2017 258.14 1814 76 27.36 4. 17.2 441 32.78 37.19 2.25 2.00 16:44 11.11 03 03 921 2446 14.53 0.81 ON 1788 1.05 2014 226.12 156.13 70.01 30.29 1973 12.36 725 227 15.44 056 OX 18.11 IN 031 08 007 41 3. 503 15.01 120 12.34 1955 LIS L 16.52 1946 013 021 001 Income Tassene Familefore Tas Nation Famig Per Share Laminer Share Duted Wehed Average Share Oding Weight Away Share Ong Gre Margin ERIT Marin Peta Mange LTDA LIIT 744 19.25 114 061 06 180 60 1.16 112 IN 111 1 13813 $23 2M 20:55 18 5.16 12.14 6.95 0.38 0 IK 184 023 0.16 004 06 2945 ITKI 21 064 03 1997 IR 12 636 011 604 4512 4131 17 013 OM TESI ( 30 LEO CO SIO 60 PIO 000 0.19 00 16 M 00 0:39 4 1415 WE 6 $9.29 44 19 00 001 Haming for To My Net Profit Marin 110 20 11 014 14 0.00 CIO NO ve 01 007 0.00 0.06 008 004 Retained Earning Intangible and Goodwill Income Statement Dashboard and Reasoning Instructions Retained Earning Intangible and Goodwill Income Statement Dashboard and Reasoning Instructions Assignment 2 Financial Statement Check all the streets on this worklook in the Distand and Reasoning sheet, create a destibad that showinstmary of the company's financial sement. Compare the data provided on Betained Emig Intangible a Goodwill and Income Statement sheets between year 2011 to 2000 and explain the best and the worst years for the company sent least one chart choose the best chart type to help you with the humanion Writet paragraphs about the best and the went years and explain your room a husiness data analyst. Your two paragraphs that should not be than 200 w Creating the band in the lition som Tinplanting 30% Project2 Check different sheets on this workbook. In the Dashboard and Reasoning sheet, create a dashboard that shows a summary of the company's financial statement. Compare the data provided on Retained Earning, Intangible and Goodwill and Income Statement sheets between the years of 2011 to 2020 and explain the best and the worst years for the company. Use at least one chart (choose the best chart type) to help you with the illustration. Write two paragraphs about the best and the worst years and explain your reasons as a business data analyst. Your two paragraphs together should not be less than 200 words. Retained Earning Intangible and Goodwill Income Statement Dashboard and Reasoning Instructions 2015 2012 2011 2030 56 Red Eaming Schedule Year Retained Esminga (Previous Year) Net Income Sock Dividends Dividend Paid Hemed lamp 2019 72 15 2018 55 12 2017 23 37 2016 3 30 2 2014 33 16 2 2013 -33 19 2 21 11 2 6 6 to 7 -70 1 44 -4 -6 Ta + 58 * - 13 Intangible and Goodwill Income Statement Dashboard and Reasoning Instructions Retained Earning Intangible and will Schedule Intangible and Goodwill Preven Year) Now Purchase Intangible and will 2020 2019 2013 2012 2018 230 2016 266 - 27 2015 275 2014 290 2011 130 194 230 238 200 306 328 430 423 Retained Earning Intangible and Goodwill Income Statement Dashboard and Reasoning Instructions 110Z 2015 2425 All members in mu Yew Reven Cost of Revenue Cross Profit Operating Tips Operaeng Income 2012 204.15 2000 329.45 221 53 10892 2725 2019 27411 194.52 7.58 273 2018 267.99 19204 7595 2016 248.2 1685 N65 2013 213.9 149 58 99.51 2.6 61 23:46 27 767 19 E IT 4. 143 14.01 25.76 788 1373 235 3464 16.00 0.9 162 18.27 2017 258.14 1814 76 27.36 4. 17.2 441 32.78 37.19 2.25 2.00 16:44 11.11 03 03 921 2446 14.53 0.81 ON 1788 1.05 2014 226.12 156.13 70.01 30.29 1973 12.36 725 227 15.44 056 OX 18.11 IN 031 08 007 41 3. 503 15.01 120 12.34 1955 LIS L 16.52 1946 013 021 001 Income Tassene Familefore Tas Nation Famig Per Share Laminer Share Duted Wehed Average Share Oding Weight Away Share Ong Gre Margin ERIT Marin Peta Mange LTDA LIIT 744 19.25 114 061 06 180 60 1.16 112 IN 111 1 13813 $23 2M 20:55 18 5.16 12.14 6.95 0.38 0 IK 184 023 0.16 004 06 2945 ITKI 21 064 03 1997 IR 12 636 011 604 4512 4131 17 013 OM TESI ( 30 LEO CO SIO 60 PIO 000 0.19 00 16 M 00 0:39 4 1415 WE 6 $9.29 44 19 00 001 Haming for To My Net Profit Marin 110 20 11 014 14 0.00 CIO NO ve 01 007 0.00 0.06 008 004 Retained Earning Intangible and Goodwill Income Statement Dashboard and Reasoning Instructions Retained Earning Intangible and Goodwill Income Statement Dashboard and Reasoning Instructions Assignment 2 Financial Statement Check all the streets on this worklook in the Distand and Reasoning sheet, create a destibad that showinstmary of the company's financial sement. Compare the data provided on Betained Emig Intangible a Goodwill and Income Statement sheets between year 2011 to 2000 and explain the best and the worst years for the company sent least one chart choose the best chart type to help you with the humanion Writet paragraphs about the best and the went years and explain your room a husiness data analyst. Your two paragraphs that should not be than 200 w Creating the band in the lition som Tinplanting 30%
Step by Step Solution
There are 3 Steps involved in it

Get step-by-step solutions from verified subject matter experts