

Question: Classify all the samples in Table below based on the USCS: table [ [ table [ [ Sieve ] , [ No .
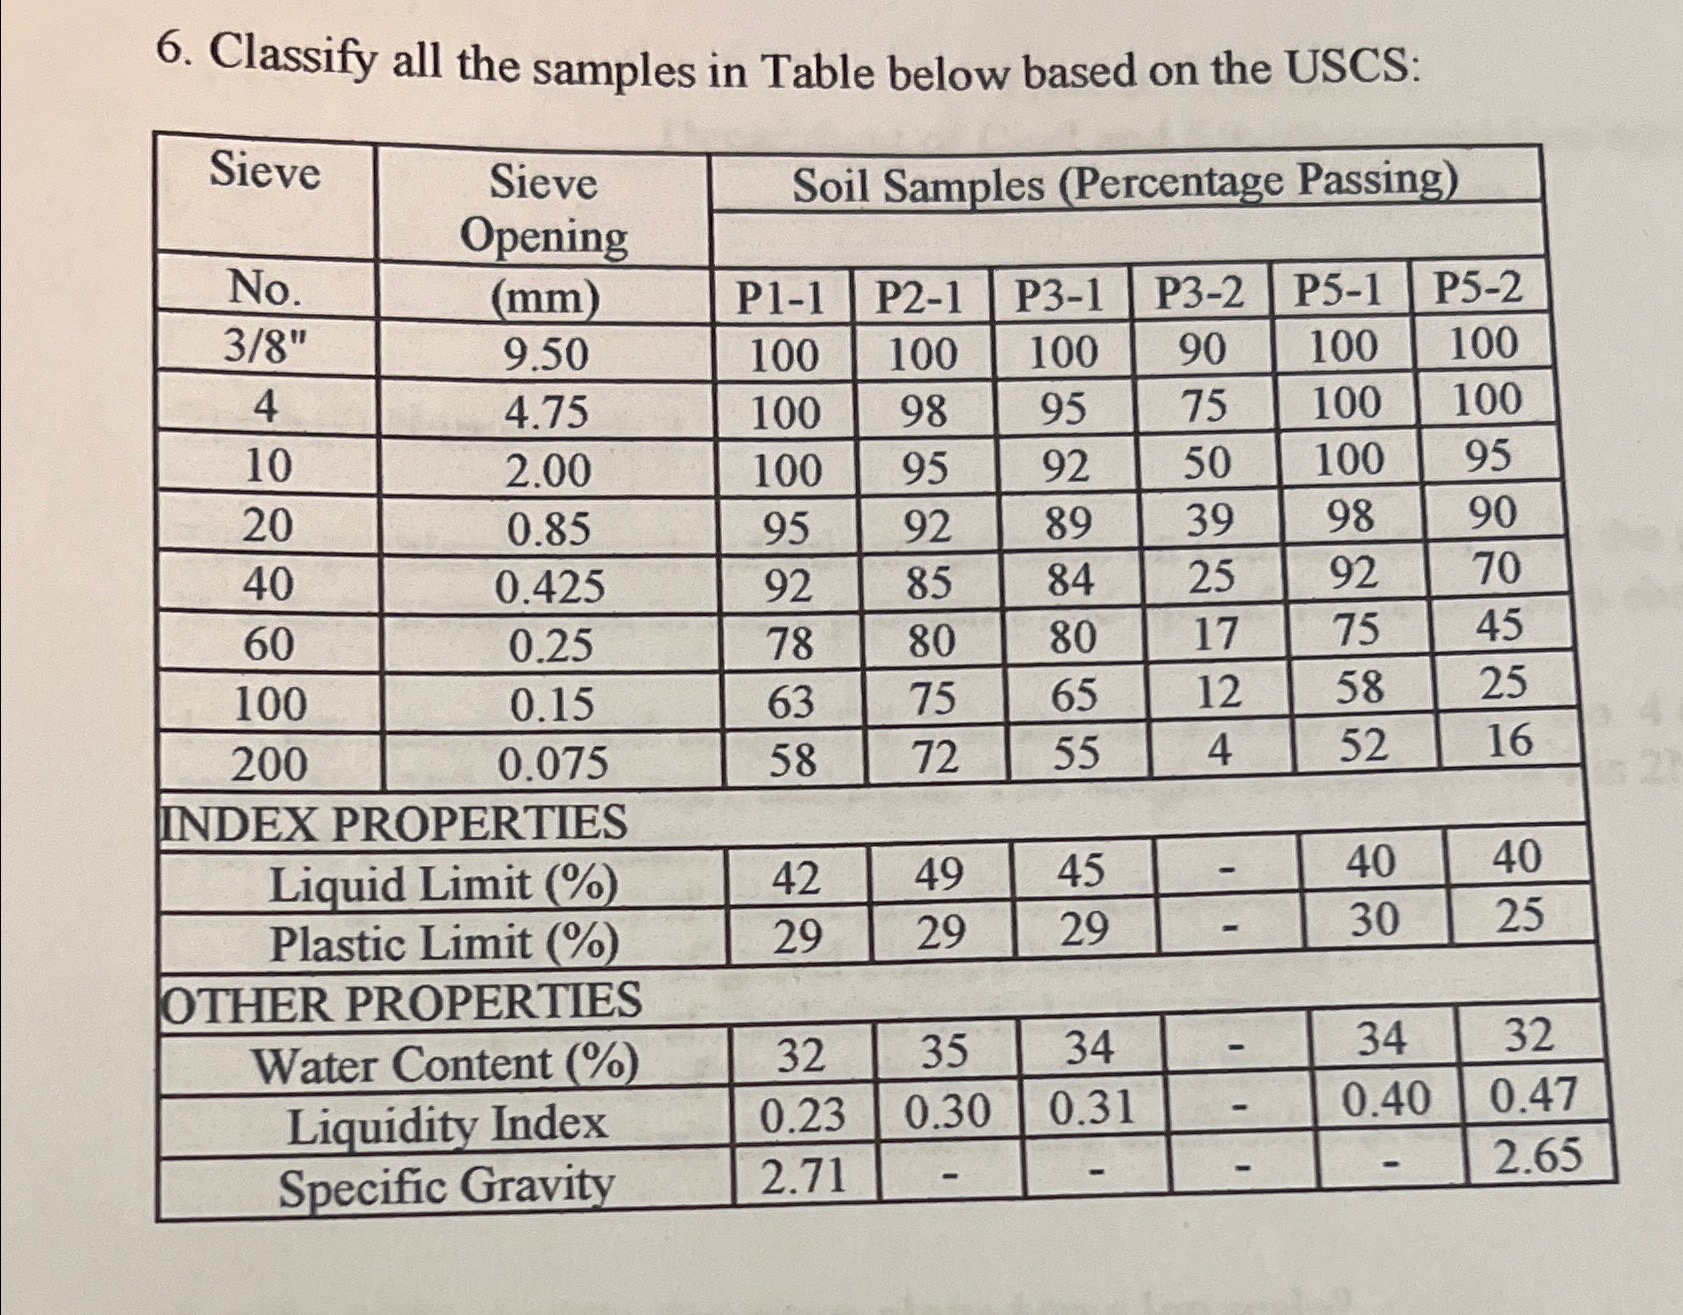
Classify all the samples in Table below based on the USCS:
tabletableSieveNotableSieveOpeningSoil Samples Percentage PassingPPPPPPINDEX PROPERTIEStablePlastic Limit THER PROPFRTIFSOTHER PROPERTIESWater Content Liquidity Index,Specific Gravity,
Step by Step Solution
There are 3 Steps involved in it
1 Expert Approved Answer
Step: 1 Unlock

Question Has Been Solved by an Expert!
Get step-by-step solutions from verified subject matter experts
Step: 2 Unlock
Step: 3 Unlock