

Question: Classify the distribution as a cross-sectional study or a time-series study Consider the following graph. Step 2 of 2: Classify the distribution as a cross-sectional
Classify the distribution as a cross-sectional study or a time-series study
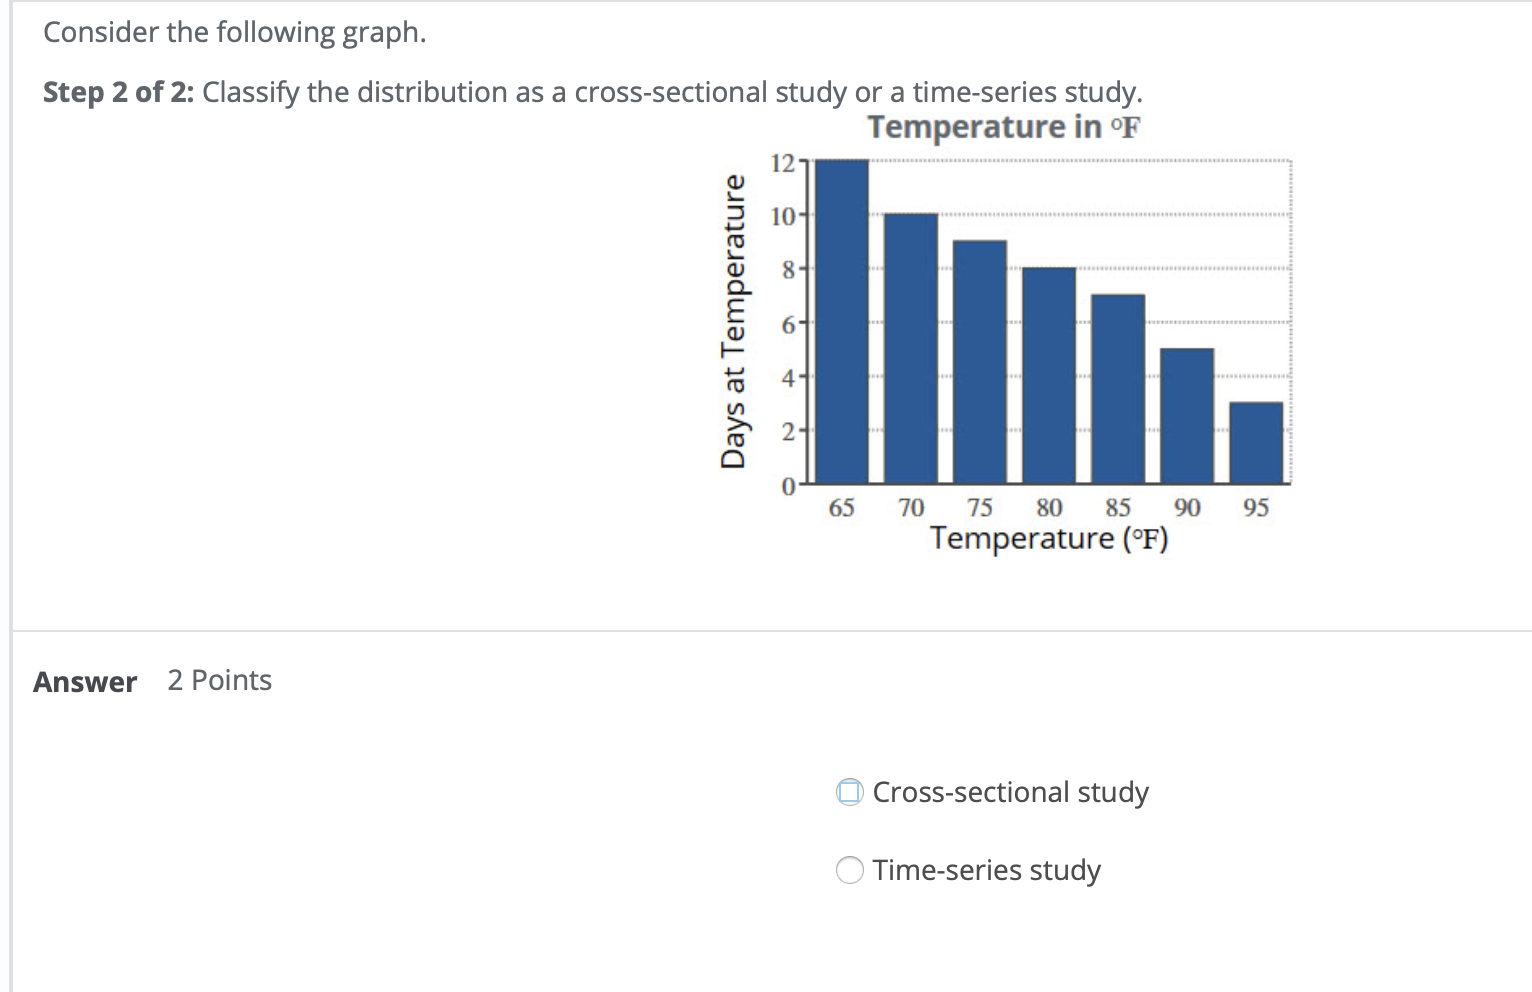
Consider the following graph. Step 2 of 2: Classify the distribution as a cross-sectional study or a time-series study. Temperature in OF Days at Temperature 12 10- 8- NA 65 70 75 80 85 90 95 Temperature (OF) Answer 2 Points Cross-sectional study O Time-series study
Step by Step Solution
There are 3 Steps involved in it
1 Expert Approved Answer
Step: 1 Unlock

Question Has Been Solved by an Expert!
Get step-by-step solutions from verified subject matter experts
Step: 2 Unlock
Step: 3 Unlock