

Question: Classify the following graph as a cross-sectional study or a time-series study. Average Temperature in F 80- 60 Temperature (F) 40- 20- 0 1 2
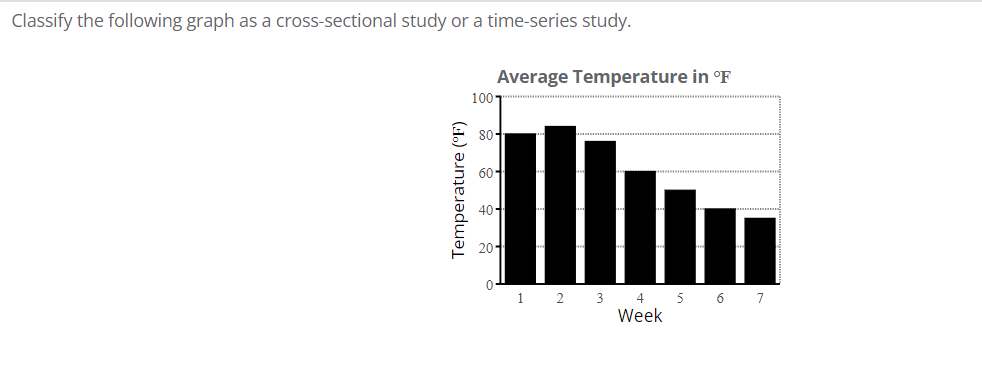


Classify the following graph as a cross-sectional study or a time-series study. Average Temperature in F 80- 60 Temperature (F) 40- 20- 0 1 2 3 4 5 6 7 Week
Step by Step Solution
There are 3 Steps involved in it
1 Expert Approved Answer
Step: 1 Unlock

Question Has Been Solved by an Expert!
Get step-by-step solutions from verified subject matter experts
Step: 2 Unlock
Step: 3 Unlock