

Question: clear clc clf oneLine = ' '; i=1; numVal = []; % Open comma-separated file fh = fopen('Cholesterol2014.csv', 'r'); % Read in one line at
clear clc clf
oneLine = ' '; i=1; numVal = [];
% Open comma-separated file fh = fopen('Cholesterol2014.csv', 'r');
% Read in one line at a time and build the numVal array while ~feof(fh) oneLine = fgetl(fh); token = textscan(oneLine,'% d','delimiter', ','); numVal = [numVal token{i}]; end %%%%%%%%%%%%%%%%%%%%%%%%%%%%%%%%%%%%%%%%%%%%%%%%%%%%%%%%%%%%%%%%%%%
% Define length of x - look at the data file (how many points on each line) % % Add title % % Prompt for the four marker and line styles % %%%%%%%%%%%%%%%%%%%%%%%%%%%%%%%%%%%%%%%%%%%%%%%%%%%%%%%%%%%%%%%%%%%
set(gca,'XTick',1:length(numVal)); set(gca,'XTickLabel',numVal(1,:));
%%%%%%%%%%%%%%%%%%%%%%%%%%%%%%%%%%%%%%%%%%%%%%%%%%%%%%%%%%%%%%%%%%%%%
% On SAME graph, plot Triglycerides, HDL Cholesterol, % VLDL Cholesterol, and LDL Cholesterol % Use the line color designated in the lab, % Use marker & line styles entered by the user % Marker face colors must be filled in and the same as the line color % % Add a legend in upperleft corner
%%%%%%%%%%%%%%%%%%%%%%%%%%%%%%%%%%%%%%%%%%%%%%%%%%%%%%%%%%%%%%%%%%%%%
![clear clc clf oneLine = ' '; i=1; numVal = []; %](https://dsd5zvtm8ll6.cloudfront.net/si.experts.images/questions/2024/09/66f541dd25783_21266f541dca9241.jpg)
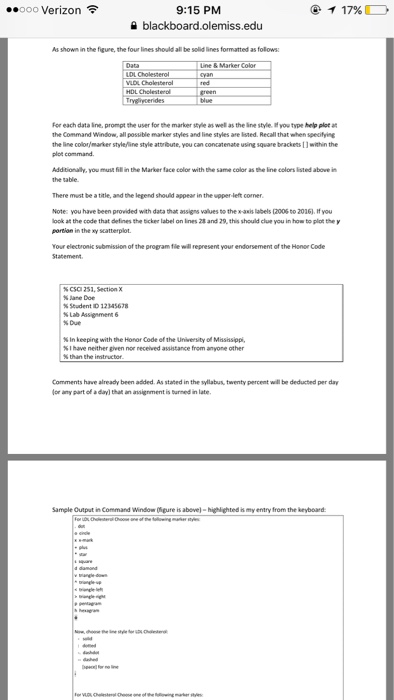
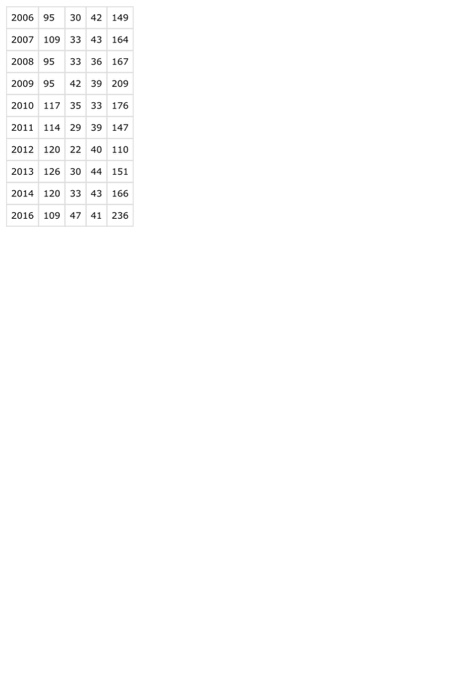
For Lab 6, you will use an xy scatterplot to graph cholesterol data from the file Cholesterol2016.csv (comma delimited file) as follows: Cholesterol Spring 2017 LDL Cholesterol VLDL Cholesterol HDL Cholesterol Triglycerides 150, 100 2010 2011 2013 2014 2016 You will not create a new file but instead download and edit graphCholspring2017.m to include the above plot, including marker styles. Code has already been provided that reads the data from Cholesterolspring2017.csv and populates the numval array: numval array 2014 2016 2006 2007 2008 2010 2011 2012 2013 95 109 114 120 126 47 33 33 42 35 42 43 36 39 33 39 40 44 43 41 151 166 236 149 164 176 147 110 You should run the file and in MATLAB's workspace window, and click on numValto verify the above data. You wil need to provide code using MATLAB's plotting commands as statedin graphcholspring2017m, approximately lines 18-26 and lines 31-41. As shown in the figure, the four lines should be formatted as follows
Step by Step Solution
There are 3 Steps involved in it

Get step-by-step solutions from verified subject matter experts