

Question: CODE IN PYTHON PLEASE CODE IN PYTHON WILL UPVOTE. = e 1. Given an energy signal x(t) e-***)*, where T=0.1 ms a. Plot its time
CODE IN PYTHON
PLEASE CODE IN PYTHON
WILL UPVOTE.
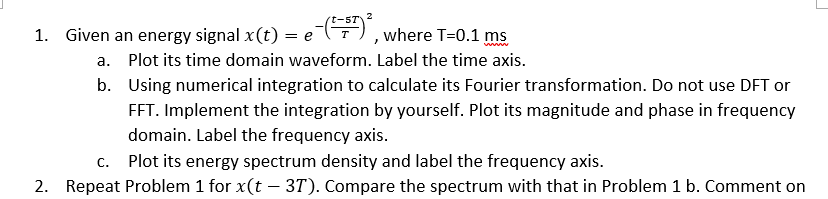
= e 1. Given an energy signal x(t) e-***)*, where T=0.1 ms a. Plot its time domain waveform. Label the time axis. b. Using numerical integration to calculate its Fourier transformation. Do not use DFT or FFT. Implement the integration by yourself. Plot its magnitude and phase in frequency domain. Label the frequency axis. Plot its energy spectrum density and label the frequency axis. 2. Repeat Problem 1 for x(t 37). Compare the spectrum with that in Problem 1 b. Comment on C. = e 1. Given an energy signal x(t) e-***)*, where T=0.1 ms a. Plot its time domain waveform. Label the time axis. b. Using numerical integration to calculate its Fourier transformation. Do not use DFT or FFT. Implement the integration by yourself. Plot its magnitude and phase in frequency domain. Label the frequency axis. Plot its energy spectrum density and label the frequency axis. 2. Repeat Problem 1 for x(t 37). Compare the spectrum with that in Problem 1 b. Comment on C
Step by Step Solution
There are 3 Steps involved in it

Get step-by-step solutions from verified subject matter experts