

Question: complete a graded assignment designed to gather data on the quantitative reasoning skills of degree graduates. 40 43 52 38 47 42 56 36 54
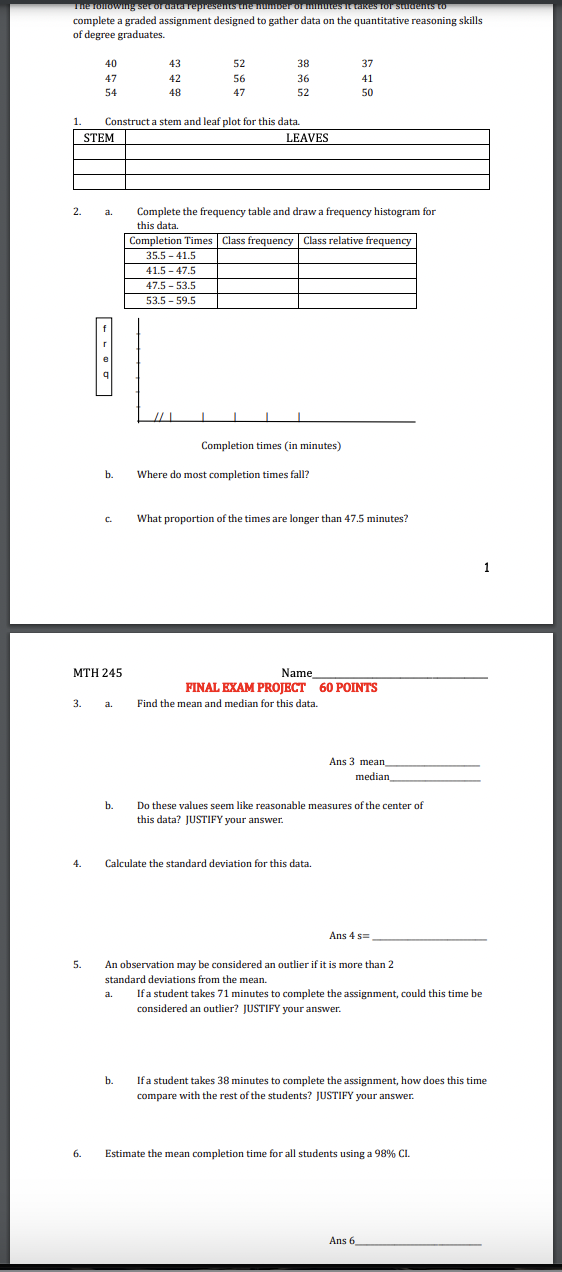
complete a graded assignment designed to gather data on the quantitative reasoning skills of degree graduates. 40 43 52 38 47 42 56 36 54 48 47 52 1 Construct a stem and leaf plot for this data. STEM LEAVES Complete the frequency table and draw a frequency histogram for this data. Completion Times | Class frequency | Class relative frequency 355-415 41.5-475 47.5 -5315 535-595 Completion times (in minutes) 'Where do most completion times fall? 'What proportion of the times are longer than 47.5 minutes? MTH 245 Name FINAL EXAM PROJECT 60 POINTS Find the mean and median for this data. Do these values seem like reasonable measures of the center of this data? JUSTIFY your answer. Calculate the standard deviation for this data. An observation may be considered an outlier if it is more than 2 standard deviations from the mean. a. If a student takes 71 minutes to complete the assignment, could this time be considered an outlier? JUSTIFY your answer. If a student takes 38 minutes to complete the assignment, how does this time compare with the rest of the students? JUSTIFY your answer. 6. Estimate the mean completion time for all students using a 98% CI
Step by Step Solution
There are 3 Steps involved in it

Get step-by-step solutions from verified subject matter experts