

Question: Using the data you collect, make Excel table and complete the items below. Create two frequency tables based on two separate questions from your survey.
Using the data you collect, make Excel table and complete the items below.
- Create two frequency tables based on two separate questions from your survey.
- make bar graph and a pie chart based on the data in the frequency tables.
- Determine the class intervals and create frequency distribution for each of the frequency tables.
- Create one frequency polygon of the data from the frequency distribution.
Conduct an analysis of your project data. Prepare the items below based on the data from two of the variables in the data collection instrument.
- Determine the mean, median, and mode for each of the variables.
- What is the variance for each set of data for each of the variables?
- What is the standard deviation for each of the variables?
- What is the probability that each event occurs in each of the two variables.
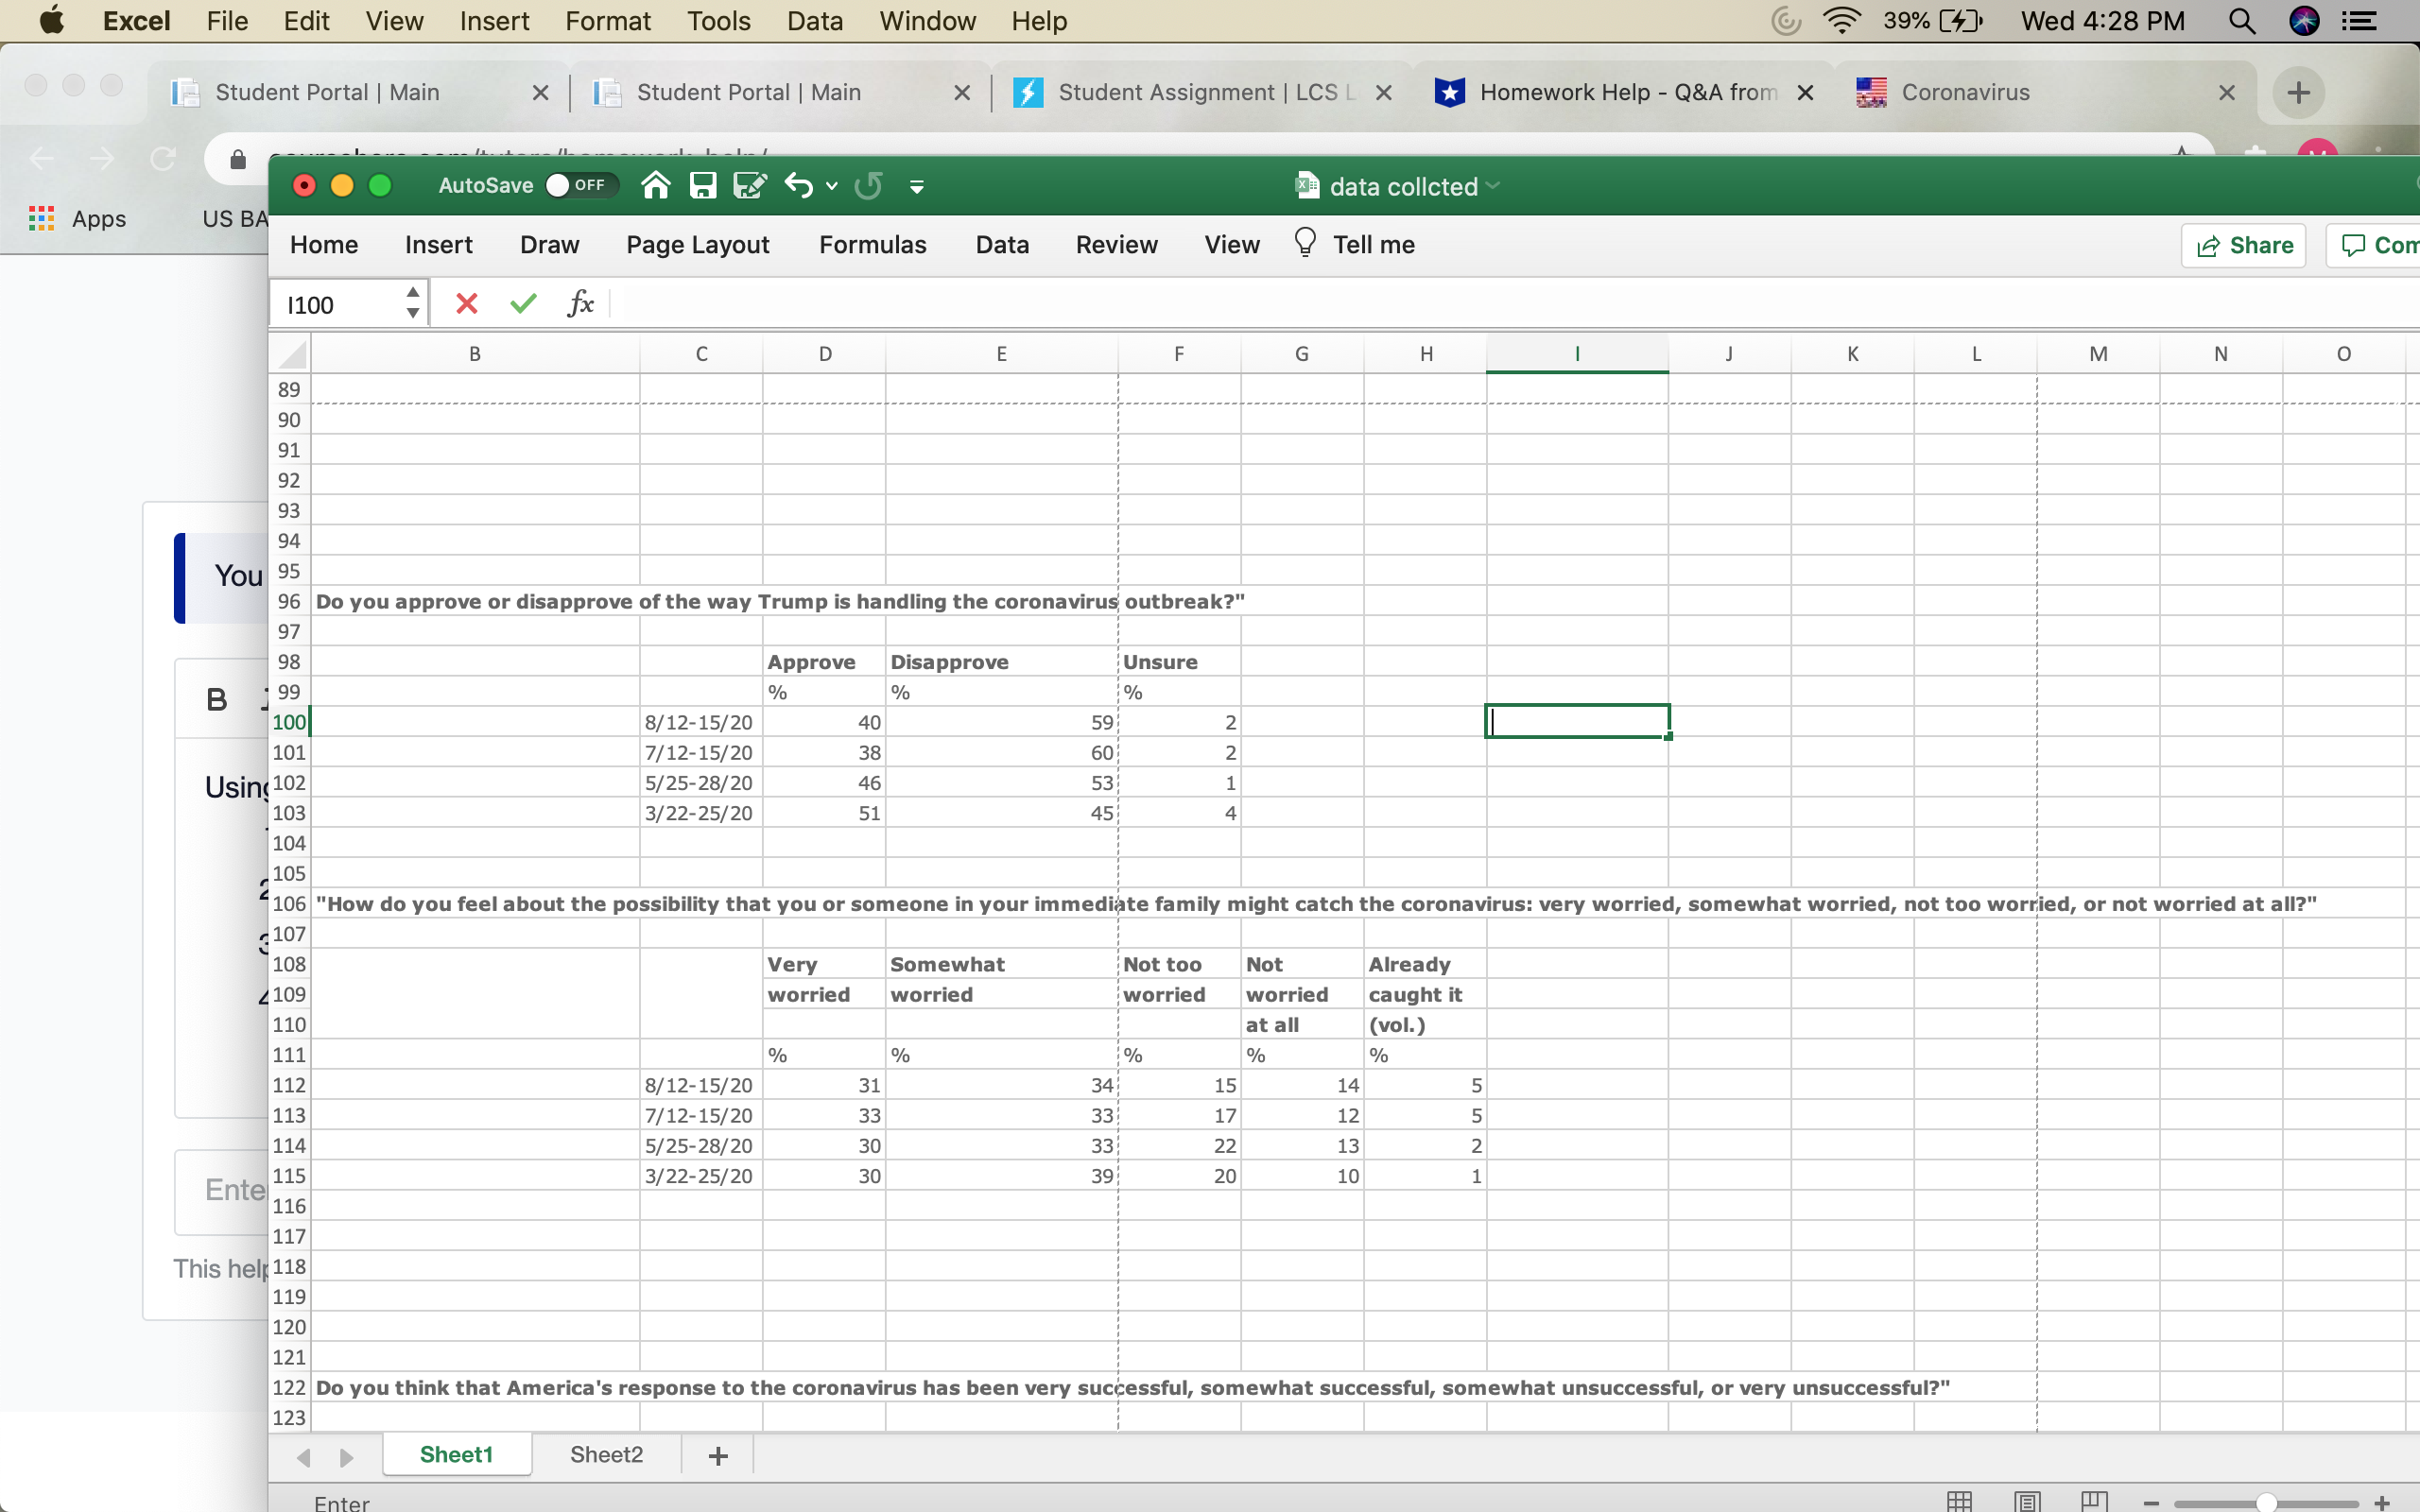
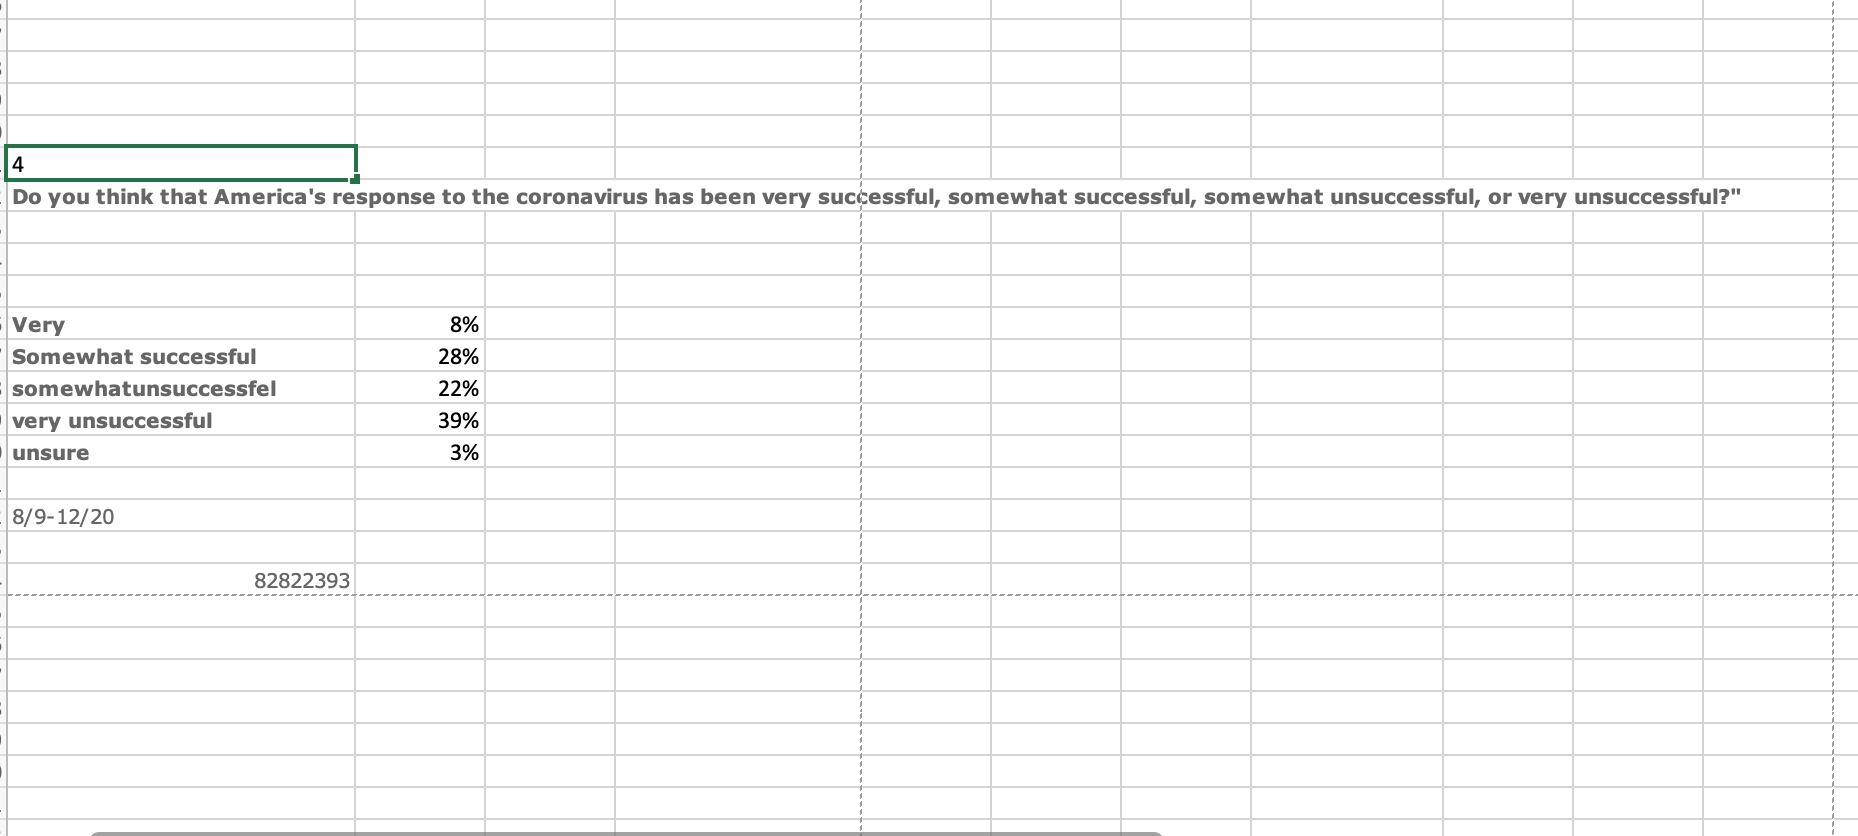
Excel File Edit View Insert Format Tools Data Window Help 39% [4. Wed 4:28 PM Q Student Portal | Main Student Portal | Main X Student Assignment | LCS L X Homework Help - Q&A from X Coronavirus X + AutoSave OFF data collcted Apps US BA Home Insert Draw Page Layout Formulas Data Review View Tell me Share Con 1100 X V fx B C D E F G H I J K L M N O 89 90 91 92 93 94 You 95 96 Do you approve or disapprove of the way Trump is handling the coronavirus outbreak?" 97 98 Approve Disapprove Unsure B 99 % % 100 8/12-15/20 40 59 101 7/12-15/20 38 60 Using102 5/25-28/20 46 53 103 3/22-25/20 51 45 HNN 104 105 106 "How do you feel about the possibility that you or someone in your immediate family might catch the coronavirus: very worried, somewhat worried, not too worried, or not worried at all?" 107 108 Very Somewhat Not too Not Already 109 worried worried worried worried caught it 110 at all (vol.) 111 % OC 112 8/12-15/20 31 34 15 14 113 7/12-15/20 33 33 17 12 114 5/25-28/20 30 33 22 13 Enter 115 3/22-25/20 30 39 20 10 - NUT 116 117 This help 118 119 120 121 122 Do you think that America's response to the coronavirus has been very successful, somewhat successful, somewhat unsuccessful, or very unsuccessful?" 123 Sheet1 Sheet2 +4 Do you think that America's response to the coronavirus has been very successful, somewhat successful, somewhat unsuccessful, or very unsuccessful?" Very 8% Somewhat successful 28% somewhatunsuccessfel 22% very unsuccessful 39% unsure 3% 8/9-12/20 82822393
Step by Step Solution
There are 3 Steps involved in it

Get step-by-step solutions from verified subject matter experts