

Question: Complete Table 1 (below) by calculating the change in concentration of hydrogen, the change in time, and the average reaction rate for each of the
Complete Table 1 (below) by calculating the change in concentration of hydrogen, the change in time, and the average reaction rate for each of the intervals (time point 1 to 2 , time point 2 to 3 , etc). The first, calculating the changes between seconds) and
t_(2)( 10.000 seconds), is done for you.\ Table 1. Concentration of hydrogen measured over time for the reaction between molecular hydrogen and molecular iodine to form hydrogen iodide, depicted graphically in Figure 4.\ \\\\table[[\\\\table[[Time],[Point]],Time
(s),
[H_(2)](M),
\\\\Delta [H_(2)](M),
\\\\Delta t(s),\\\\table[[Rate
=-\\\\Delta (H_(2))/(\\\\Delta )t 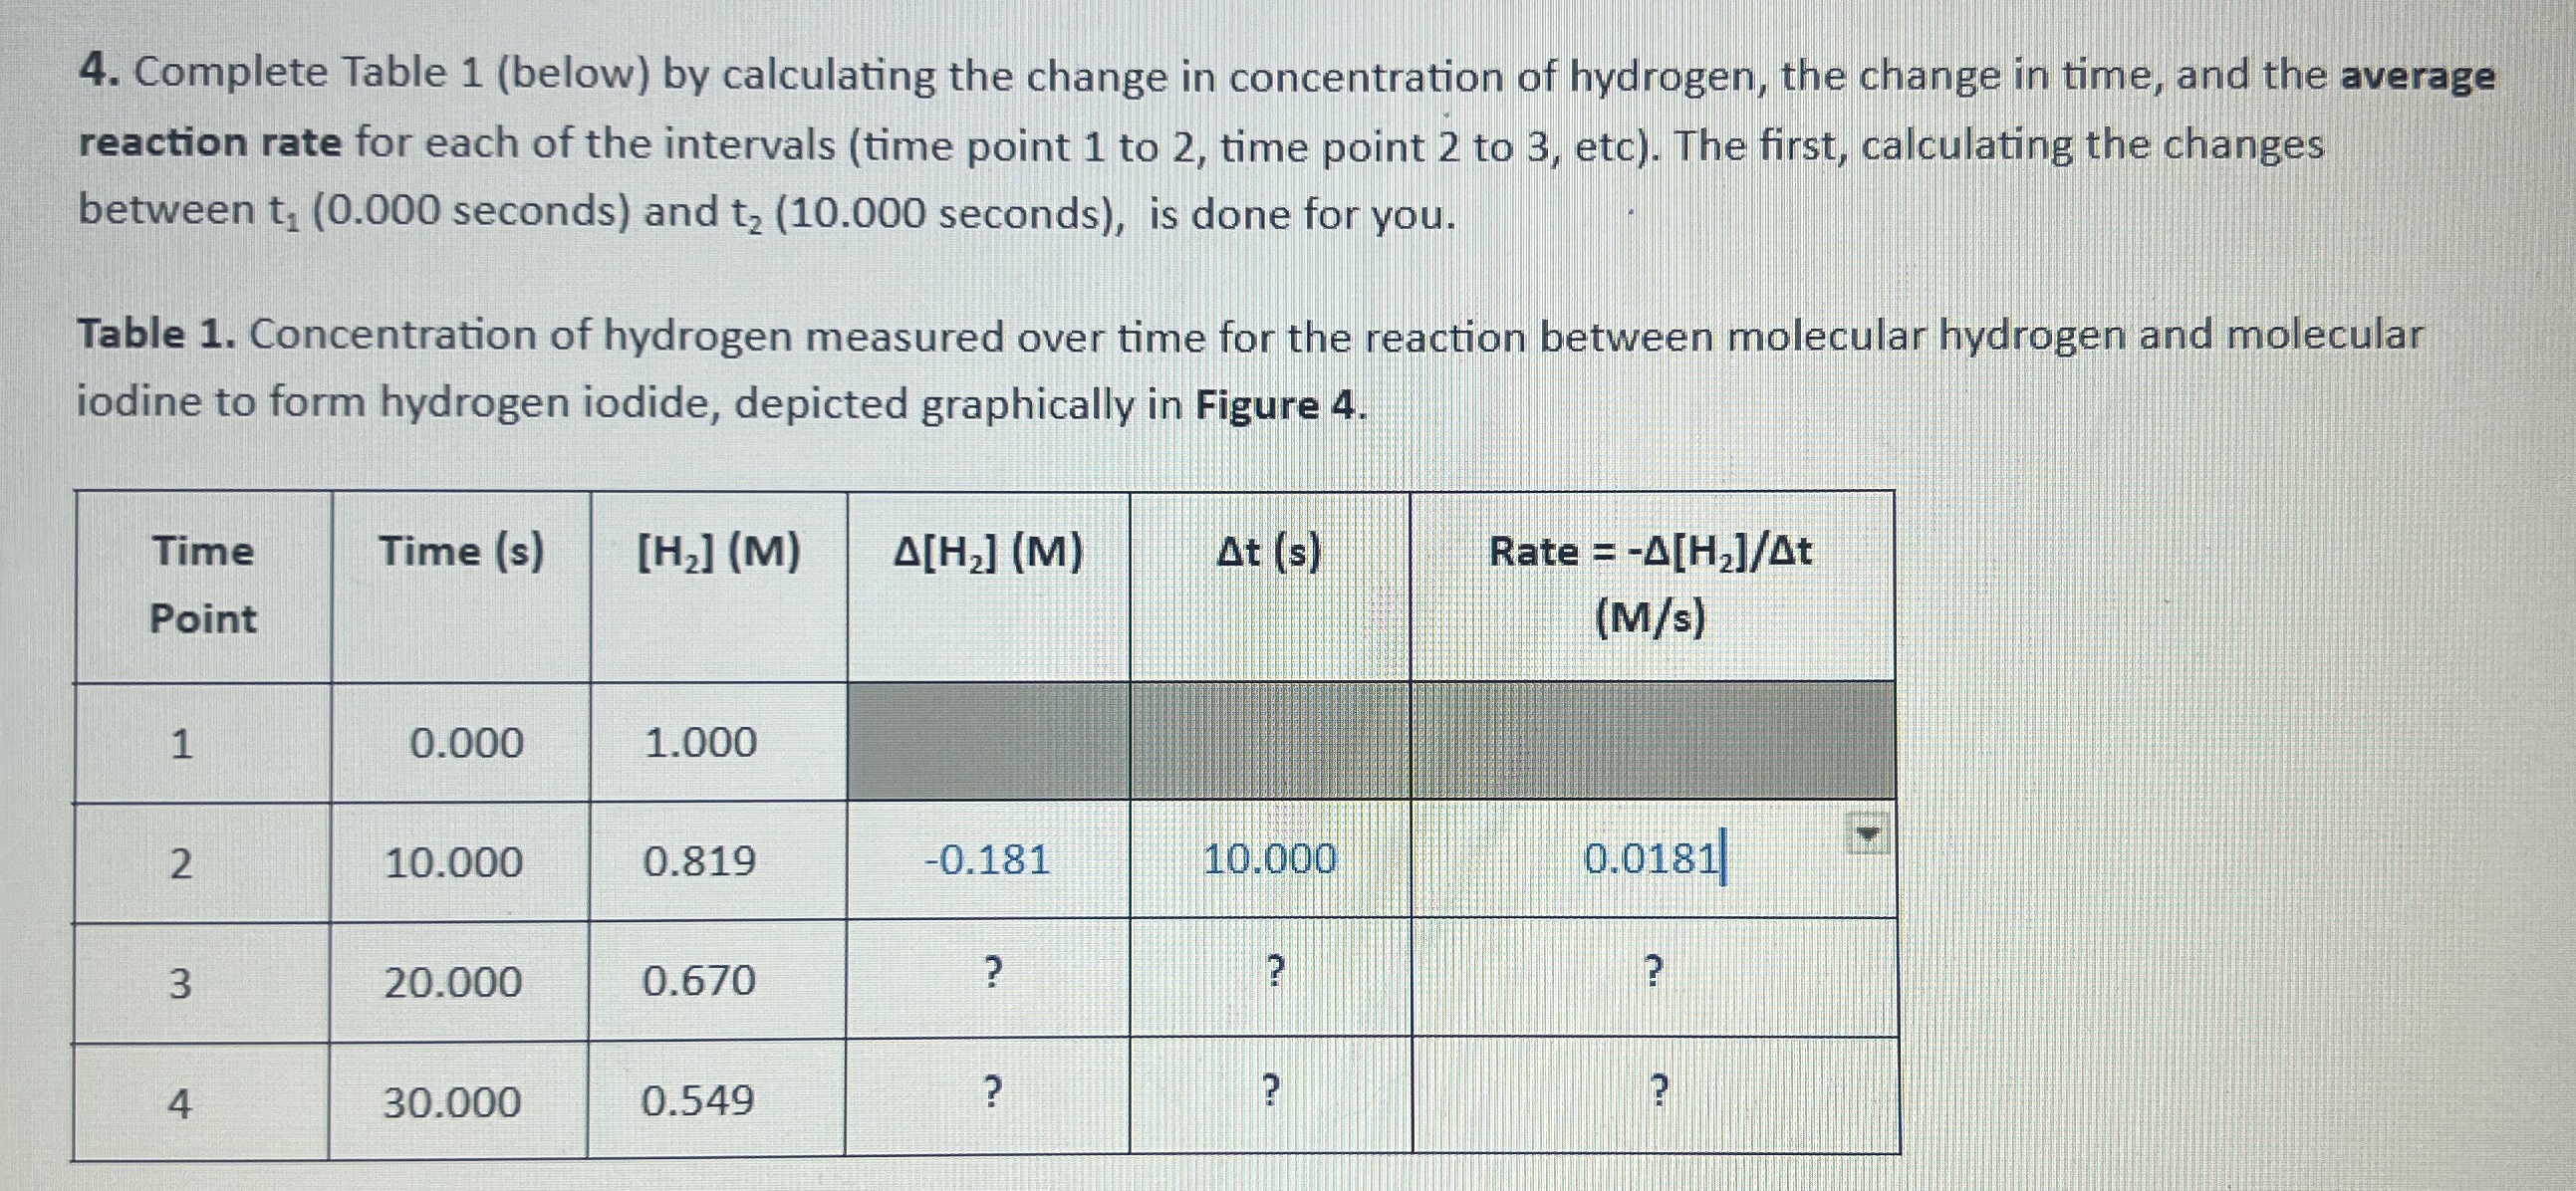
Step by Step Solution
There are 3 Steps involved in it
1 Expert Approved Answer
Step: 1 Unlock

Question Has Been Solved by an Expert!
Get step-by-step solutions from verified subject matter experts
Step: 2 Unlock
Step: 3 Unlock