

Question: Complete the below table to calculate income statement data in common - size percents. Note: Round your percentage answers to 2 decimal places. KORBIN COMPANY
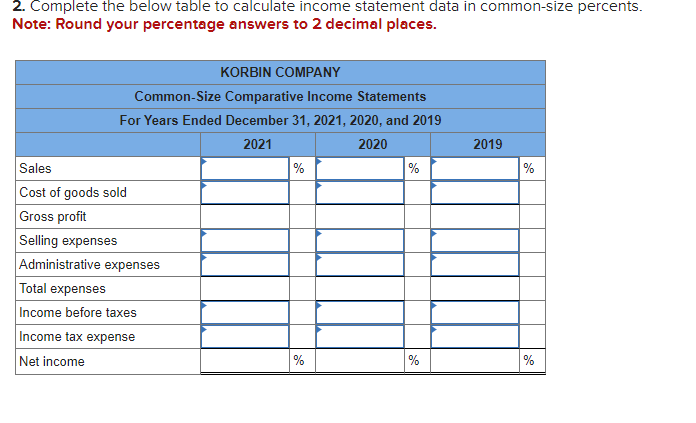
Complete the below table to calculate income statement data in commonsize percents.
Note: Round your percentage answers to decimal places.
KORBIN COMPANY
CommonSize Comparative Income Statements
For Years Ended December and Selected comparative financial statements of Korbin Company follow.
KORBIN COMPANY
Comparative Income Statements
For Years Ended December
Sales $ $ $
Cost of goods sold
Gross profit
Selling expenses
Administrative expenses
Total expenses
Income before taxes
Income tax expense
Net income $ $ $
KORBIN COMPANY
Comparative Balance Sheets
December
Assets
Current assets $ $ $
Longterm investments
Plant assets, net
Total assets $ $ $
Liabilities and Equity
Current liabilities $ $ $
Common stock
Other paidin capital
Retained earnings
Total liabilities and equity $ $ $
Complete the below table to calculate income statement data in commonsize percents.
Step by Step Solution
There are 3 Steps involved in it
1 Expert Approved Answer
Step: 1 Unlock

Question Has Been Solved by an Expert!
Get step-by-step solutions from verified subject matter experts
Step: 2 Unlock
Step: 3 Unlock