

Question: Consider following data of a small project given in Table. a. Calculate the critical path and project duration. b. Plot the resources graph and Gantt
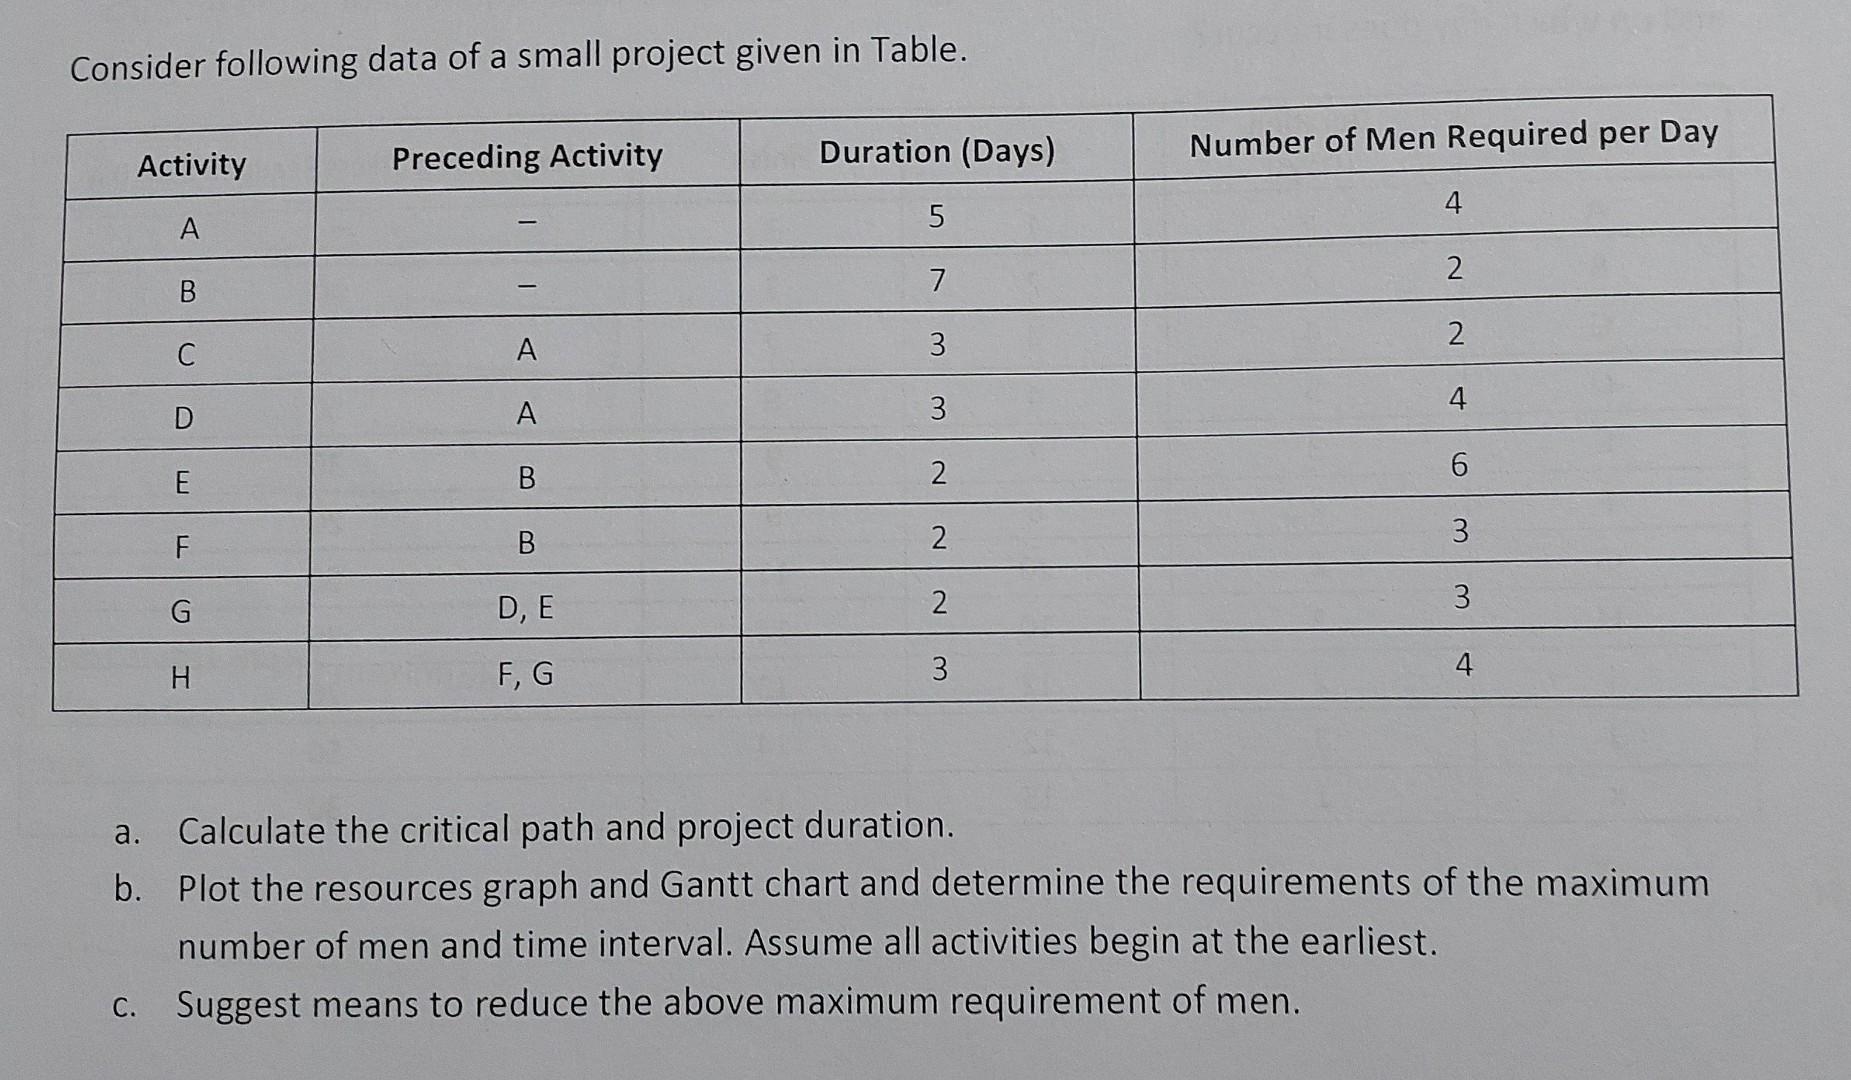
Consider following data of a small project given in Table. a. Calculate the critical path and project duration. b. Plot the resources graph and Gantt chart and determine the requirements of the maximum number of men and time interval. Assume all activities begin at the earliest. c. Suggest means to reduce the above maximum requirement of men
Step by Step Solution
There are 3 Steps involved in it
1 Expert Approved Answer
Step: 1 Unlock

Question Has Been Solved by an Expert!
Get step-by-step solutions from verified subject matter experts
Step: 2 Unlock
Step: 3 Unlock