

Question: Consider the data contained in the table below, which lists 30 monthly excess retums to two different actively managed stock portfollos ( A and B
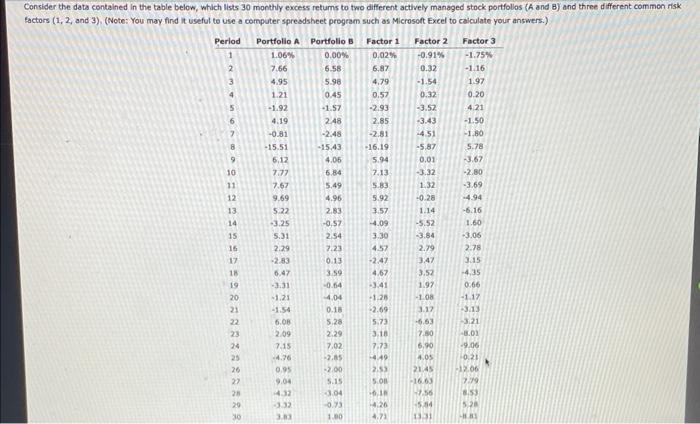
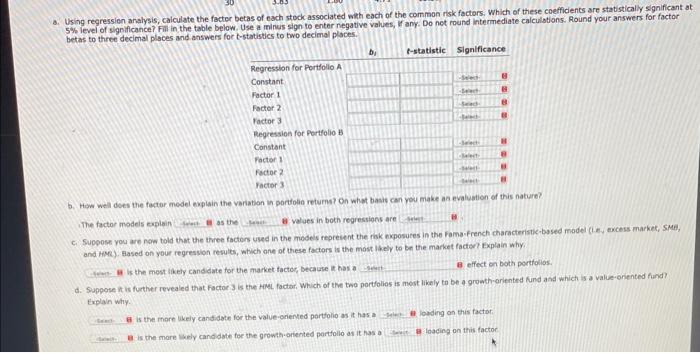
Consider the data contained in the table below, which lists 30 monthly excess retums to two different actively managed stock portfollos ( A and B ) and three different cammon risk Eactors (1,2, and 3), (Note: You may find it useful to use a computer spresdsheet program such as Microsoft Excel to calculate your answers.) a. Using regression aralysis, calculate the facter betas of each steck associated wihh each of the common risk factors. Which of these coefficients are statistically significant at 5% level of significance? Fili in the table below. Use a mines sign to enter negative values, If any. Do net round intermediate calculations. Aound your answers for factor betas to three decimal places and answers for t-statistics to two decimal places. 6. How well does the factor medel expisin the variabon in portfois retums? on what basit can you make an evaluation of this nature? The tactor modeis expisin as the values in both regressions are C. Sugpose you are now told that the three factors used in the modeis reprecent the rakk noposuces in the Fama-french characteristic-based madel (i.e.j axcess market, SMa. and HM2). Fased on your regression resules, which one of these factors is the most lakel to ben the market factert texplain why. I is the mest likely candidate for the market factor, because it has a effect on both portfolios. d. Suppose i is further revealed that factor 3 is the Hhe. factar, Which of the two portolios is most likely to be a growehiariented Kund and which is a value onented fund? Explain why. is the more likely candidate for the value oriented portfolio as it has a londing on this factor. is the mare liely candidate toe the growth oriented portollo as it has a Ioacing on this factor Consider the data contained in the table below, which lists 30 monthly excess retums to two different actively managed stock portfollos ( A and B ) and three different cammon risk Eactors (1,2, and 3), (Note: You may find it useful to use a computer spresdsheet program such as Microsoft Excel to calculate your answers.) a. Using regression aralysis, calculate the facter betas of each steck associated wihh each of the common risk factors. Which of these coefficients are statistically significant at 5% level of significance? Fili in the table below. Use a mines sign to enter negative values, If any. Do net round intermediate calculations. Aound your answers for factor betas to three decimal places and answers for t-statistics to two decimal places. 6. How well does the factor medel expisin the variabon in portfois retums? on what basit can you make an evaluation of this nature? The tactor modeis expisin as the values in both regressions are C. Sugpose you are now told that the three factors used in the modeis reprecent the rakk noposuces in the Fama-french characteristic-based madel (i.e.j axcess market, SMa. and HM2). Fased on your regression resules, which one of these factors is the most lakel to ben the market factert texplain why. I is the mest likely candidate for the market factor, because it has a effect on both portfolios. d. Suppose i is further revealed that factor 3 is the Hhe. factar, Which of the two portolios is most likely to be a growehiariented Kund and which is a value onented fund? Explain why. is the more likely candidate for the value oriented portfolio as it has a londing on this factor. is the mare liely candidate toe the growth oriented portollo as it has a Ioacing on this factor
Step by Step Solution
There are 3 Steps involved in it

Get step-by-step solutions from verified subject matter experts