

Question: Consider the data given in Table 2 relating to stock prices and GDP for the period 1980 2006. a. Estimate the OLS regression yt=1+2Xt+ut (5
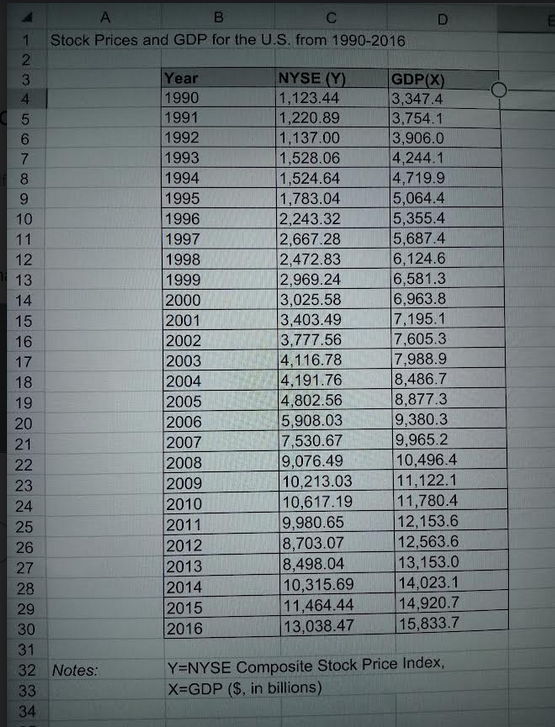
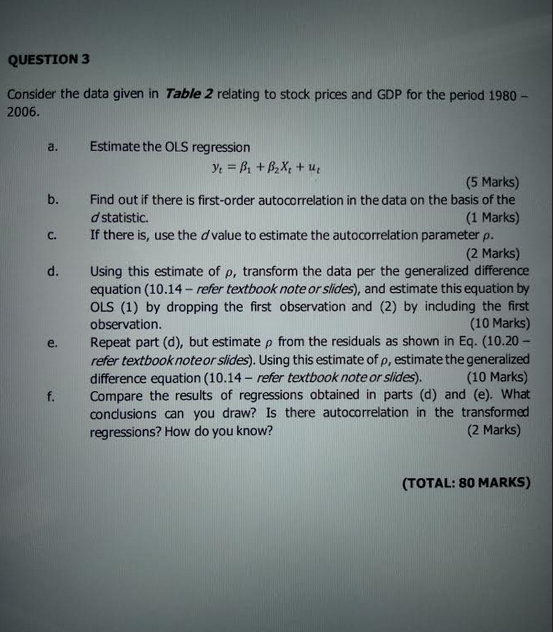
Consider the data given in Table 2 relating to stock prices and GDP for the period 1980 2006. a. Estimate the OLS regression yt=1+2Xt+ut (5 Marks) b. Find out if there is first-order autocorrelation in the data on the basis of the d statistic. (1 Marks) c. If there is, use the d value to estimate the autocorrelation parameter . (2 Marks) d. Using this estimate of , transform the data per the generalized difference equation (10.14 - refer textbook note or slides), and estimate this equation by OLS (1) by dropping the first observation and (2) by induding the first observation. (10 Marks) e. Repeat part (d), but estimate from the residuals as shown in Eq. (10.20 refer textbooknoteor slides). Using this estimate of , estimate the generalized difference equation (10.14 - refer textbook note or slides). (10 Marks) f. Compare the results of regressions obtained in parts (d) and (e). What condusions can you draw? Is there autocorrelation in the transformed regressions? How do you know? (2 Marks)
Step by Step Solution
There are 3 Steps involved in it

Get step-by-step solutions from verified subject matter experts