

Question: Consider the data in Table 2; compute the breakeven point for ticket sales and the expected profit using average revenue per ticket and average cost
Consider the data in Table 2; compute the breakeven point for ticket sales and the expected profit using average revenue per ticket and average cost per ticket. What is the safety margin? [Hint: Calculate “Expected” Total Tickets Sales, given the probability distribution. Note, data in Table 2 is at Total (Overall) ticket-levels]
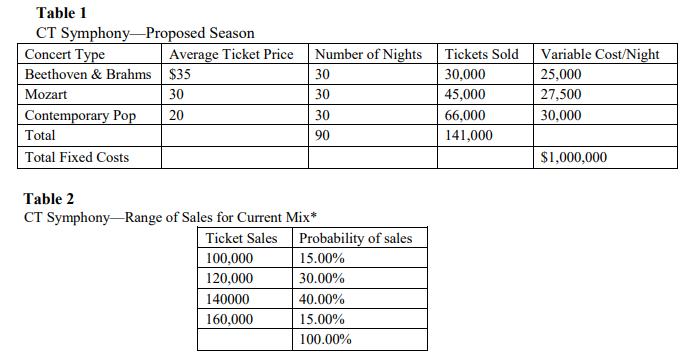
Table 1 CT Symphony-Proposed Season Concert Type Beethoven & Brahms Mozart Contemporary Pop Total Total Fixed Costs Average Ticket Price $35 30 20 Number of Nights 30 30 30 90 Table 2 CT Symphony Range of Sales for Current Mix* Ticket Sales 100,000 120,000 140000 160,000 Probability of sales 15.00% 30.00% 40.00% 15.00% 100.00% Tickets Sold 30,000 45,000 66,000 141,000 Variable Cost/Night 25,000 27,500 30,000 $1,000,000
Step by Step Solution
3.45 Rating (148 Votes )
There are 3 Steps involved in it

Get step-by-step solutions from verified subject matter experts