

Question: Consider the financial statement data and stock price data for Mydeco Corp. a. By what percentage did Mydeco's revenues grow each year from 2015 to
Consider the financial statement data and stock price data for Mydeco Corp.
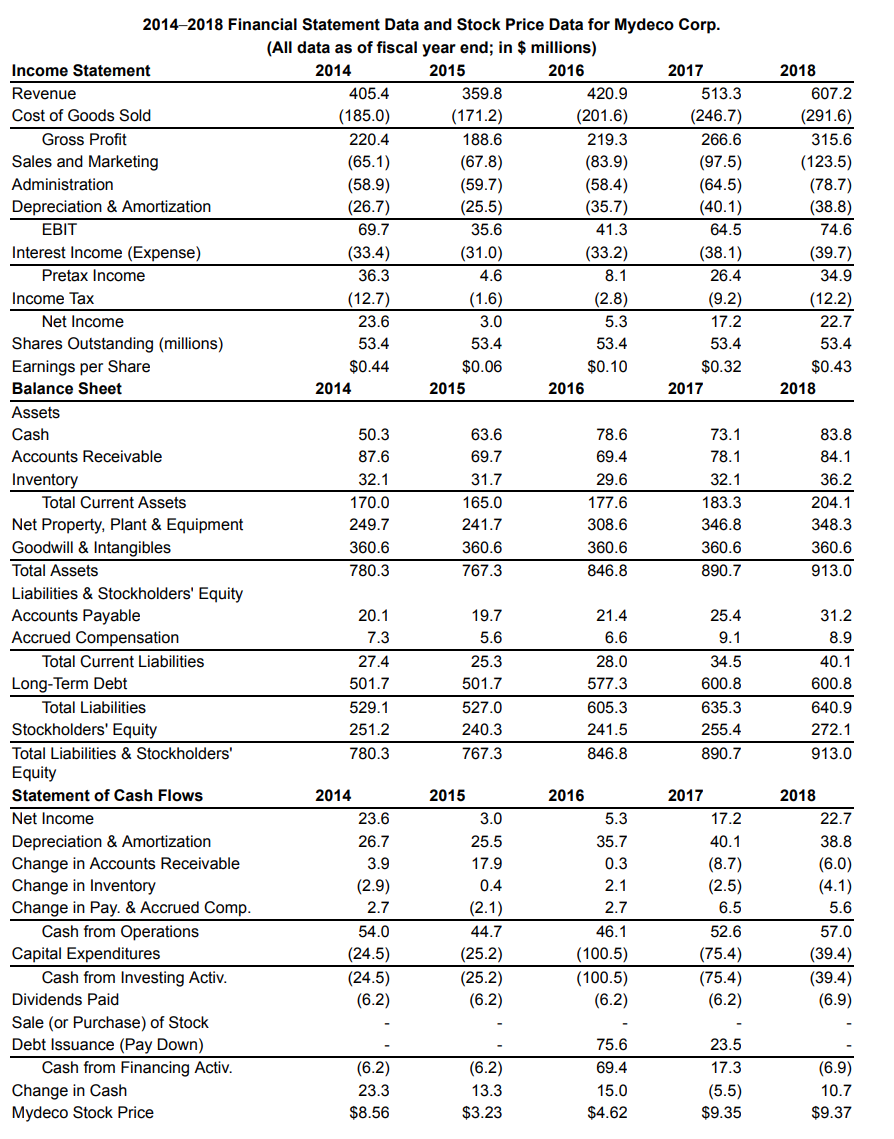
a. By what percentage did Mydeco's revenues grow each year from 2015 to 2018?
b. By what percentage did net income grow each year?
c. Why might the growth rates of revenues and net income differ?
2018 607.2 (291.6) 315.6 (123.5) (78.7) (38.8) 74.6 (39.7) 34.9 (12.2) 22.7 53.4 $0.43 2018 2014-2018 Financial Statement Data and Stock Price Data for Mydeco Corp. (All data as of fiscal year end; in $ millions) Income Statement 2014 2015 2016 2017 Revenue 405.4 359.8 420.9 513.3 Cost of Goods Sold (185.0) (171.2) (201.6) (246.7) Gross Profit 220.4 188.6 219.3 266.6 Sales and Marketing (65.1) (67.8) (83.9) (97.5) Administration (58.9) (59.7) (58.4) (64.5) Depreciation & Amortization (26.7) (25.5) (35.7) (40.1) EBIT 69.7 35.6 41.3 64.5 Interest Income (Expense) (33.4) (31.0) (33.2) (38.1) Pretax Income 36.3 4.6 8.1 26.4 Income Tax (12.7) (1.6) (2.8) (9.2) Net Income 23.6 3.0 5.3 17.2 Shares Outstanding (millions) 53.4 53.4 53.4 53.4 Earnings per Share $0.44 $0.06 $0.10 $0.32 Balance Sheet 2014 2015 2016 2017 Assets Cash 50.3 63.6 78.6 73.1 Accounts Receivable 87.6 69.7 69.4 78.1 Inventory 32.1 31.7 29.6 32.1 Total Current Assets 170.0 165.0 177.6 183.3 Net Property, Plant & Equipment 249.7 241.7 308.6 346.8 Goodwill & Intangibles 360.6 360.6 360.6 360.6 Total Assets 780.3 767.3 846.8 890.7 Liabilities & Stockholders' Equity Accounts Payable 20.1 19.7 21.4 25.4 Accrued Compensation 7.3 5.6 6.6 9.1 Total Current Liabilities 27.4 25.3 28.0 34.5 Long-Term Debt 501.7 501.7 577.3 600.8 Total Liabilities 529.1 527.0 605.3 635.3 Stockholders' Equity 251.2 240.3 241.5 255.4 Total Liabilities & Stockholders' 780.3 767.3 846.8 890.7 Equity Statement of Cash Flows 2014 2015 2016 2017 Net Income 23.6 3.0 5.3 17.2 Depreciation & Amortization 26.7 25.5 35.7 40.1 Change in Accounts Receivable 3.9 17.9 0.3 (8.7) Change in Inventory (2.9) 0.4 2.1 (2.5) Change in Pay. & Accrued Comp. 2.7 (2.1) 2.7 6.5 Cash from Operations 54.0 44.7 46.1 52.6 Capital Expenditures (24.5) (25.2) (100.5) (75.4) Cash from Investing Activ. (24.5) (25.2) (100.5) (75.4) Dividends Paid (6.2) (6.2) (6.2) (6.2) Sale (or Purchase) of Stock Debt Issuance (Pay Down) 75.6 23.5 Cash from Financing Activ. (6.2) (6.2) 69.4 17.3 Change in Cash 23.3 13.3 15.0 (5.5) Mydeco Stock Price $8.56 $3.23 $4.62 $9.35 83.8 84.1 36.2 204.1 348.3 360.6 913.0 31.2 8.9 40.1 600.8 640.9 272.1 913.0 2018 22.7 38.8 (6.0) (4.1) 5.6 57.0 (39.4) (39.4) (6.9) (6.9) 10.7 $9.37
Step by Step Solution
There are 3 Steps involved in it

Get step-by-step solutions from verified subject matter experts