

Question: Consider the following data for two variables, x and 3;. Heel File: data 16-03.:Is 11 a. Choose the correct scatter diagram with a: and y.
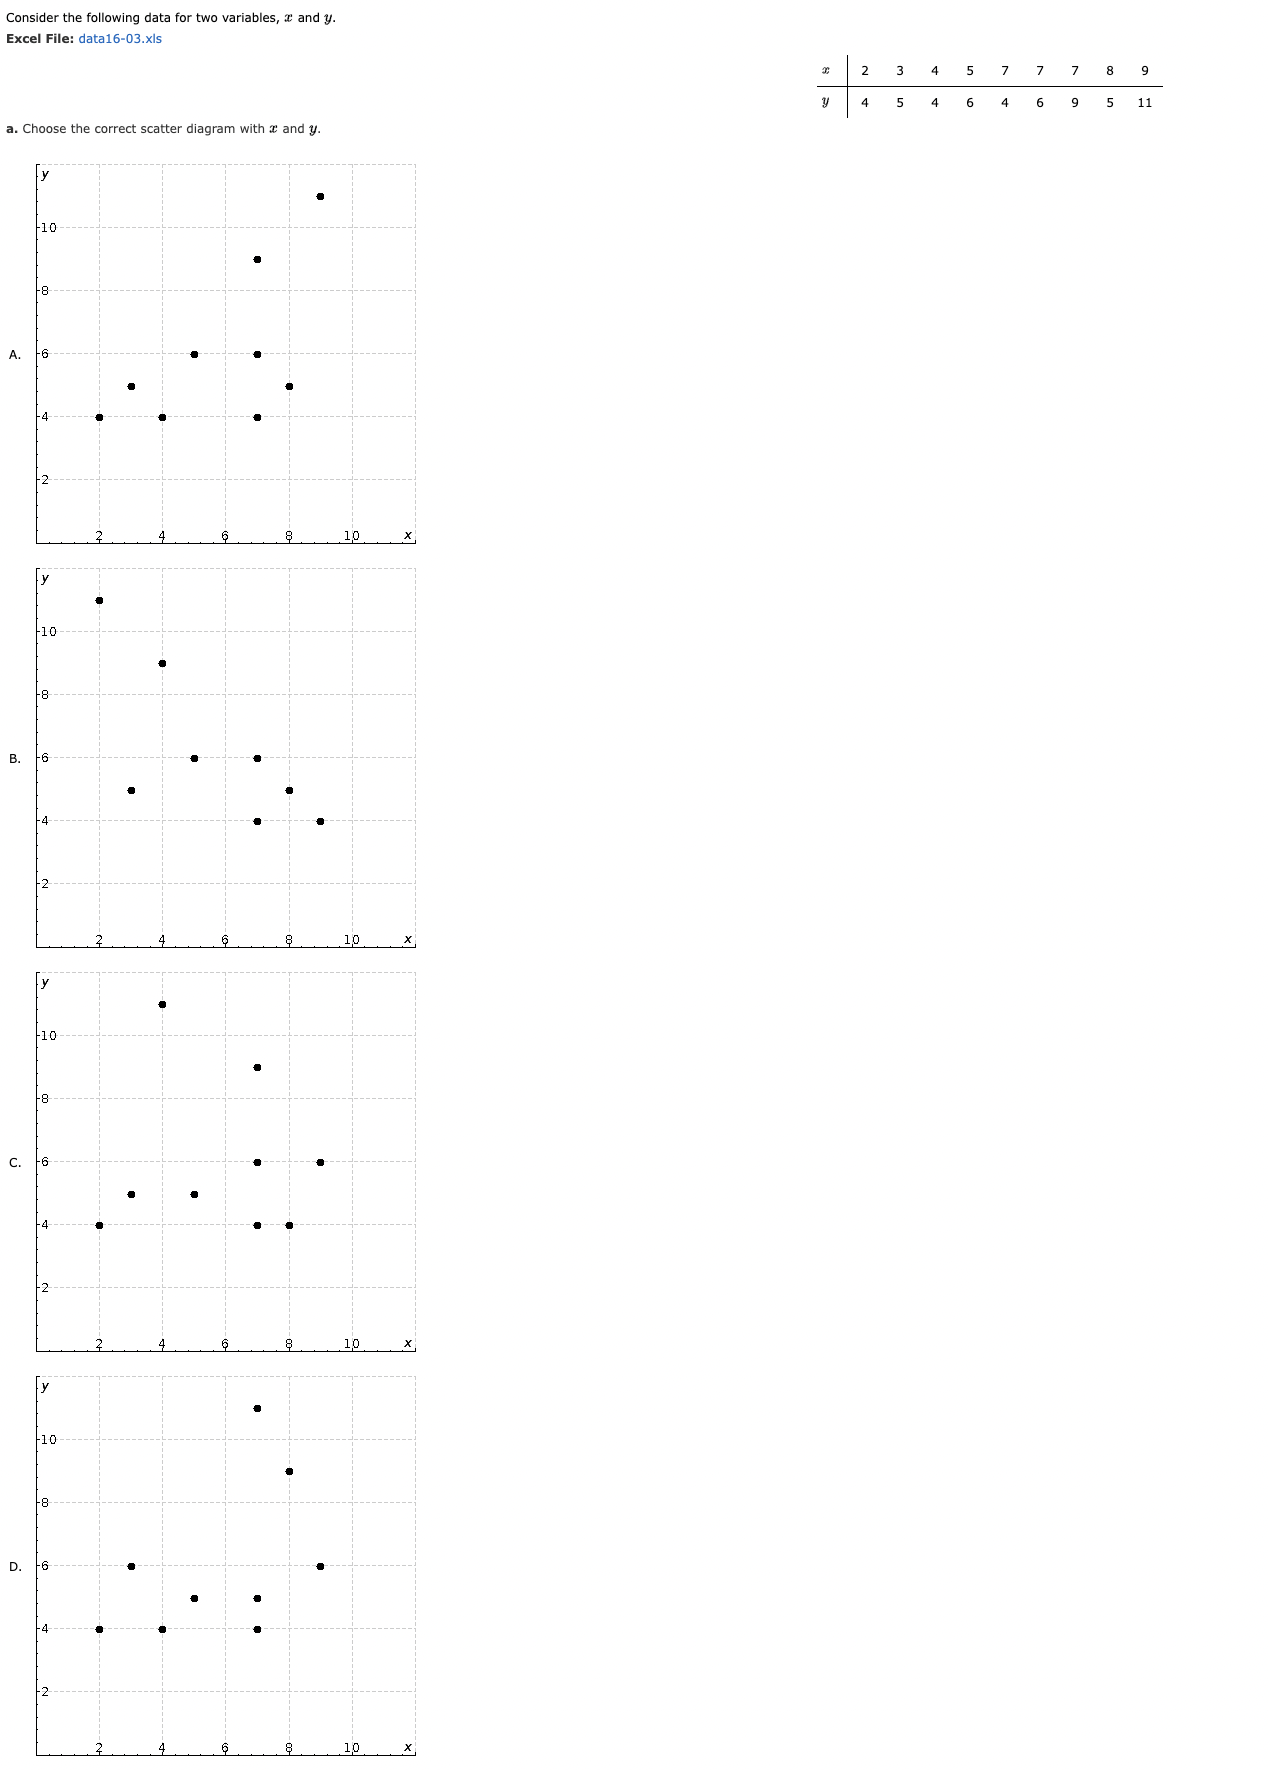
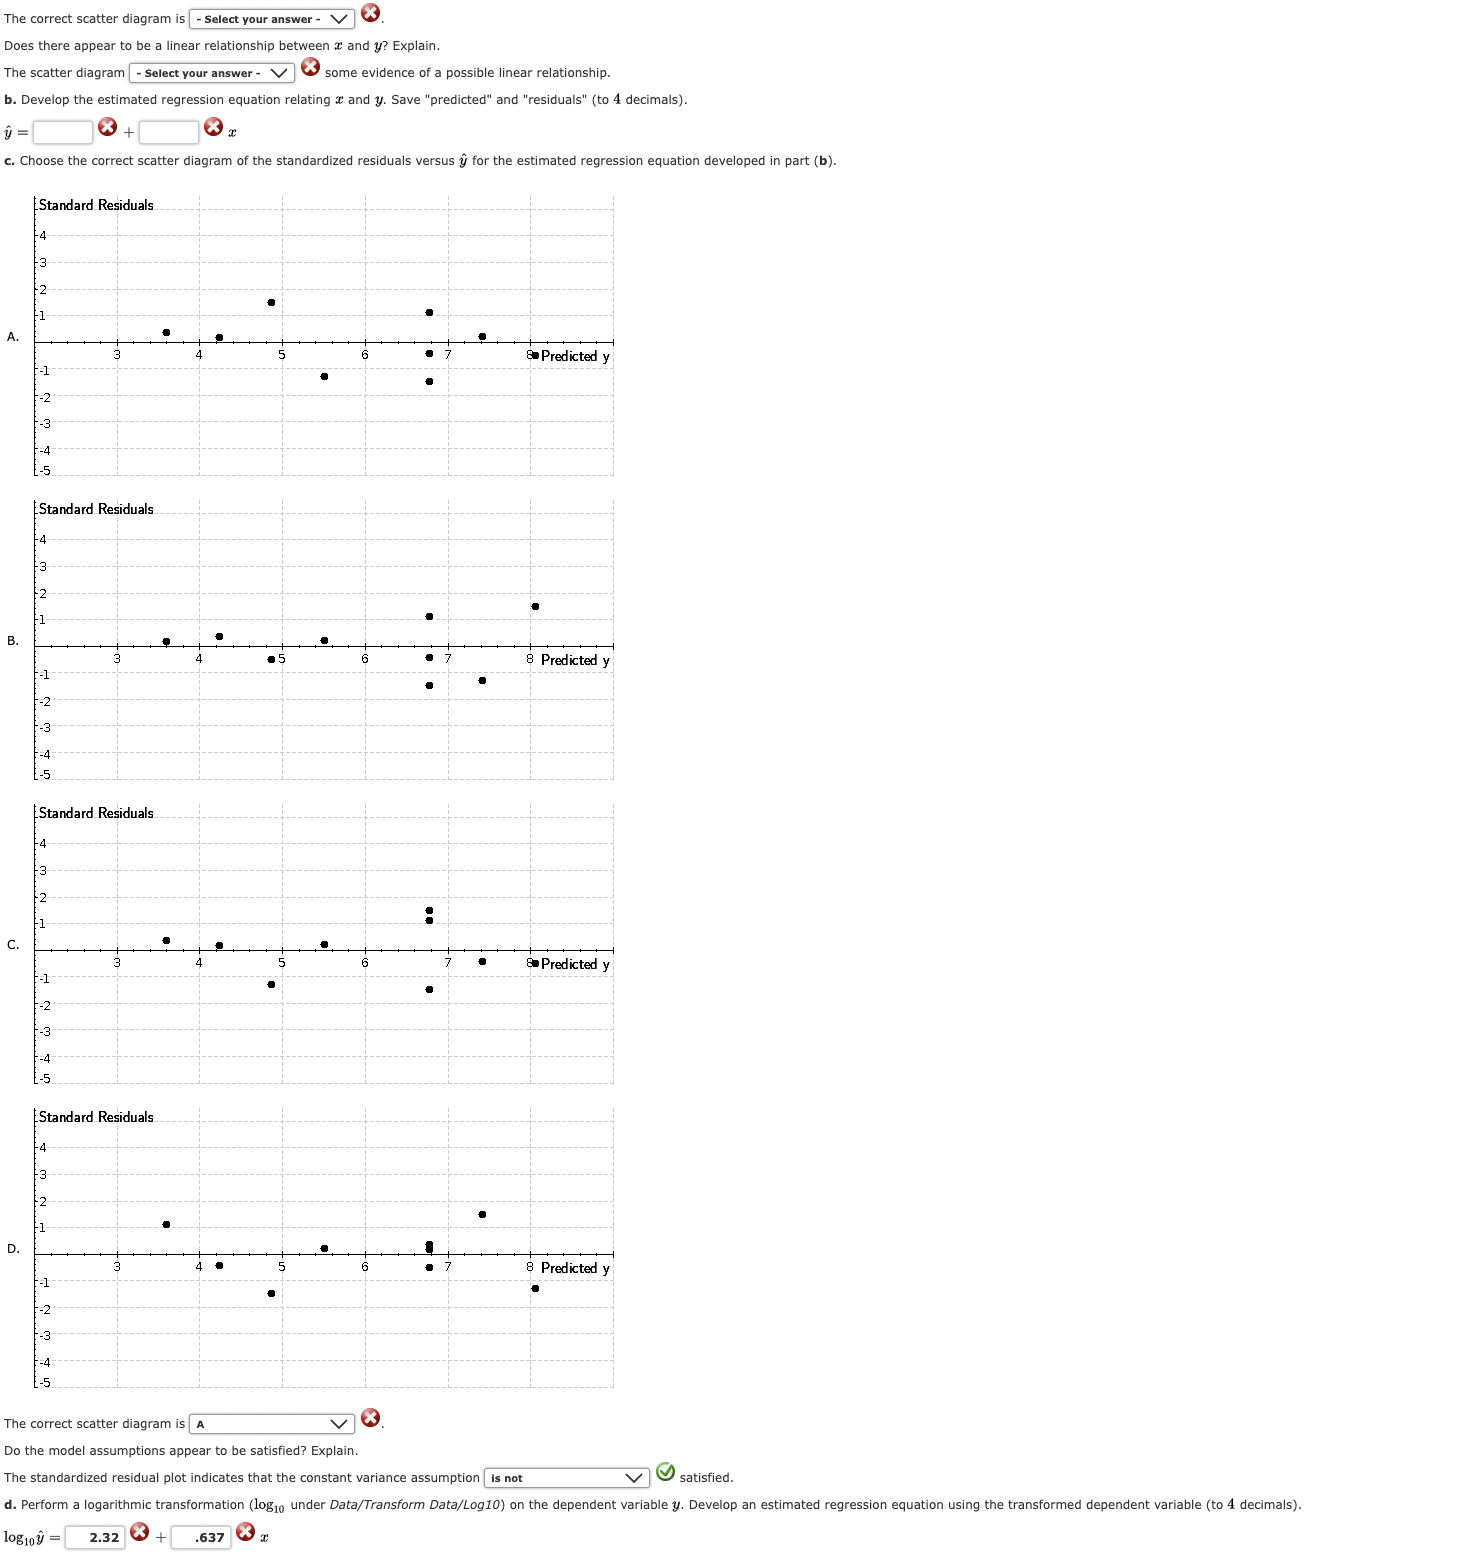
Consider the following data for two variables, x and 3;. Heel File: data 16-03.:Is 11 a. Choose the correct scatter diagram with a: and y. 4.... ....._.. +--- ______J__________L___ The correct scatter diagram is |- Select your answer - V . Does there appear to be a linear relationship between a and y? Explain. scatter di swer - V some evidence of a possible linear relationship. . Develop the estimated regression equation relating & and y. Save "predicted" and "residuals" (to 4 decimals). 1 = x + c. Choose the correct scatter diagram of the standardized residuals versus y for the estimated regression equation developed in part (b). Standard Residuals 4 Predicted y 1-2 -4 Standard Residuals .5 8 Predicted y 1- 4- Standard Residuals 5 Predicted y 1-2 -4- Standard Residuals D. Predicted y F-2- -3- -4- The correct scatter diagram is |A V X Do the model as pear to be satisfied? Explain. The standardized residual plot indicates that the constant variance assumption |is not satisfied . d. Perform a logarithmic transformation (log10 under Data/Transform Data/Log10) on the dependent variable y. Develop an estimated regression equation using the transformed dependent variable (to 4 decimals). 10g109 = 2.32 + .637
Step by Step Solution
There are 3 Steps involved in it

Get step-by-step solutions from verified subject matter experts