

Question: Consider the following data on the time spent running on a treadmill and calories burnt of 6 adults. a. Develop a scatter diagram for these
Consider the following data on the time spent running on a treadmill and calories burnt of 6 adults.
a. Develop a scatter diagram for these data. Does the scatter diagram indicate any outliers in the data? In general, what implications does this finding have for simple linear regression?
b. Develop an estimated regression equation that can be used to predict the calories burnt given the time spent running on a treadmill.
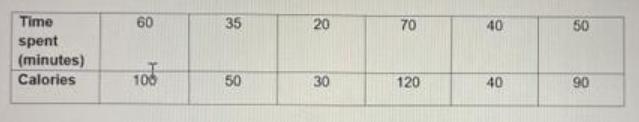
Time 60 35 20 70 40 50 spent (minutes) Calories 100 50 30 120 40 90
Step by Step Solution
3.52 Rating (165 Votes )
There are 3 Steps involved in it
b Reqression equation Time spentminutes Calories 60 100 SUMMARY OUTPUT 35 50 20 30 Regression Statis... View full answer

Get step-by-step solutions from verified subject matter experts