

Question: Consider the following regression model and corresponding output for a dataset with n = 20 observations: y=B+Bx2+B3X3+BXa+BXg+u What is the t statistic for the
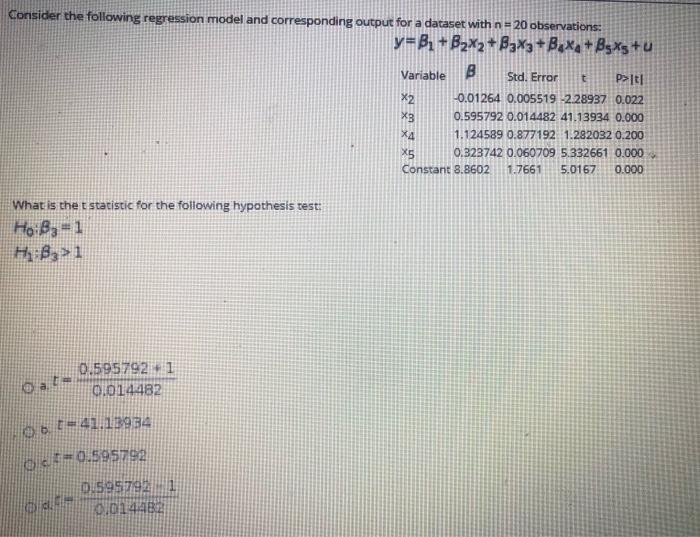
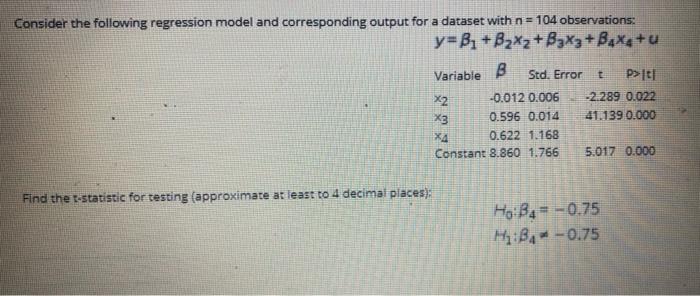
Consider the following regression model and corresponding output for a dataset with n = 20 observations: y=B+Bx2+B3X3+BXa+BXg+u What is the t statistic for the following hypothesis test: Ho: B=1 HB1 Date 0.595792 1 0.014482 6-41.13934 0-0.595792 pate 0.595792 0.014482 Std. Error t P>It B -0.01264 0.005519 -2.28937 0.022 0.595792 0.014482 41.13934 0.000 1.124589 0.877192 1.282032 0.200 0.323742 0.060709 5.332661 0.000 Constant 8.8602 1.7661 5.0167 0.000 Variable X2 X3 X4 X5 Consider the following regression model and corresponding output for a dataset with n=104 observations: y=B+Bx2+B3X3+B4X4+U Find the t-statistic for testing (approximate at least to 4 decimal places): B -0.012 0.006 0.596 0.014 0.622 1.168 Constant 8.860 1.766 5.017 0.000 Variable X2 x3 XA Std. Error t P>It -2.289 0.022 41.139 0.000 Ho:B4= -0.75 HB-0.75
Step by Step Solution
3.48 Rating (158 Votes )
There are 3 Steps involved in it
a from the above information we have to test null and a... View full answer

Get step-by-step solutions from verified subject matter experts