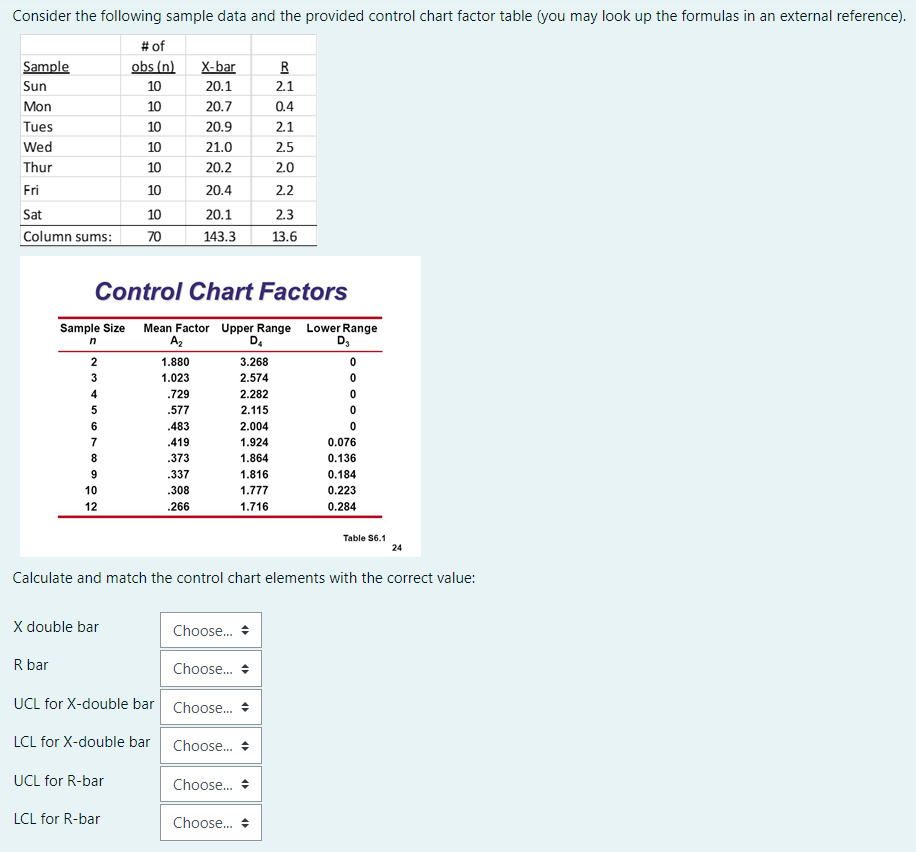
Question: Consider the following sample data and the provided control chart factor table (you may look up the formulas in an external reference). # of Sample

Consider the following sample data and the

Consider the following sample data and the provided control chart factor table (you may look up the formulas in an external reference). # of Sample obs (n) X-bar R Sun 10 20.1 2.1 Mon 10 20.7 0.4 Tues 10 20.9 2.1 Wed 10 21.0 2.5 Thur 10 20.2 2.0 Fri 10 20.4 2.2 Sat 10 20.1 2.3 Column sums: 70 143.3 13.6 aaaaaa R Control Chart Factors Sample Size Mean Factor Upper Range n Az D 2 1.880 3.268 1.023 2.574 4 .729 2.282 .577 2.115 .483 2.004 .419 1.924 .373 1.864 .337 1.816 10 .308 1.777 12 .266 1.716 NOOOOOWN Lower Range D 0 0 0 0 0 0.076 0.136 0.184 0.223 0.284 Table S6.1 24 Calculate and match the control chart elements with the correct value: X double bar Choose... R bar Choose... UCL for X-double bar Choose... - LCL for X-double bar Choose... UCL for R-bar Choose... LCL for R-bar Choose

Step by Step Solution

There are 3 Steps involved in it

1 Expert Approved Answer
Step: 1 Unlock blur-text-image
Question Has Been Solved by an Expert!

Get step-by-step solutions from verified subject matter experts

Step: 2 Unlock
Step: 3 Unlock

Students Have Also Explored These Related General Management Questions!