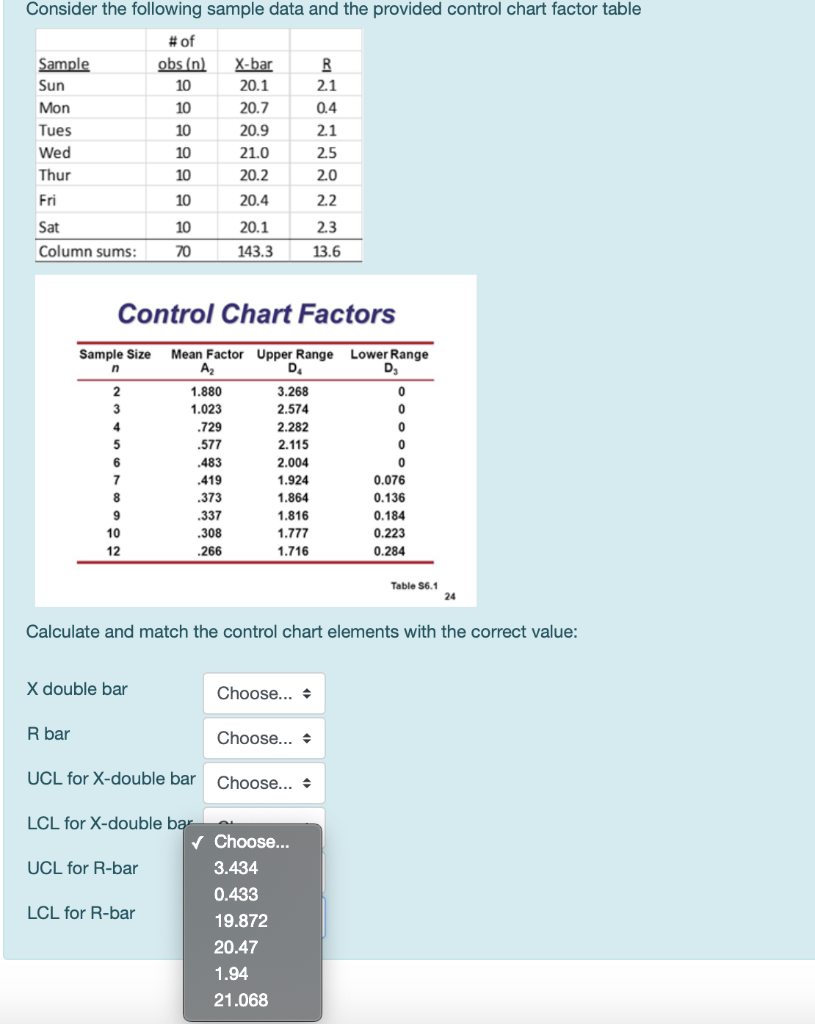
Question: Consider the following sample data and the provided control chart factor table # of obs (n) Sample Sun 10 23 Mon Tues Wed X-bar 20.1

Consider the following sample data and theConsider the following sample data and the

Consider the following sample data and the provided control chart factor table # of obs (n) Sample Sun 10 23 Mon Tues Wed X-bar 20.1 20.7 20.9 21.0 20.2 20.4 20.1 25 Thur 10 2.0 Fri 2.2 Sat Column sums: 2.3 13.6 70 143.3 Control Chart Factors Sample Size Mean Factor Upper Range Lower Range A DA D NOOOO OWNS 1.880 1.023 .729 .577 .483 .419 OOOOO 3.268 2.574 2.282 2.115 2.004 1.924 1.864 1.816 1.777 1.716 .373 .337 .308 .266 0.076 0.136 0.184 0.223 0.284 Table 56.1 Calculate and match the control chart elements with the correct value: X double bar Choose... R bar Choose... - UCL for X-double bar Choose... - LCL for X-double bar Choose... UCL for R-bar 3.434 0.433 LCL for R-bar 19.872 20.47 1.94 21.068 Match the SPC control chart type to the appropriate use case: Measures a specific property of the output Choose... Measures the range of a specific property of the output Choose... Measures the percent of output that is defective Measure the count of defects per unit Choose... C-chart R chart X chart p-chart

Step by Step Solution

There are 3 Steps involved in it

1 Expert Approved Answer
Step: 1 Unlock blur-text-image
Question Has Been Solved by an Expert!

Get step-by-step solutions from verified subject matter experts

Step: 2 Unlock
Step: 3 Unlock

Students Have Also Explored These Related General Management Questions!