

Question: Consider the following time series data. Week 1 23 5 6 Value 18 13 15 12 18 15 Using the naive method (most recent value)
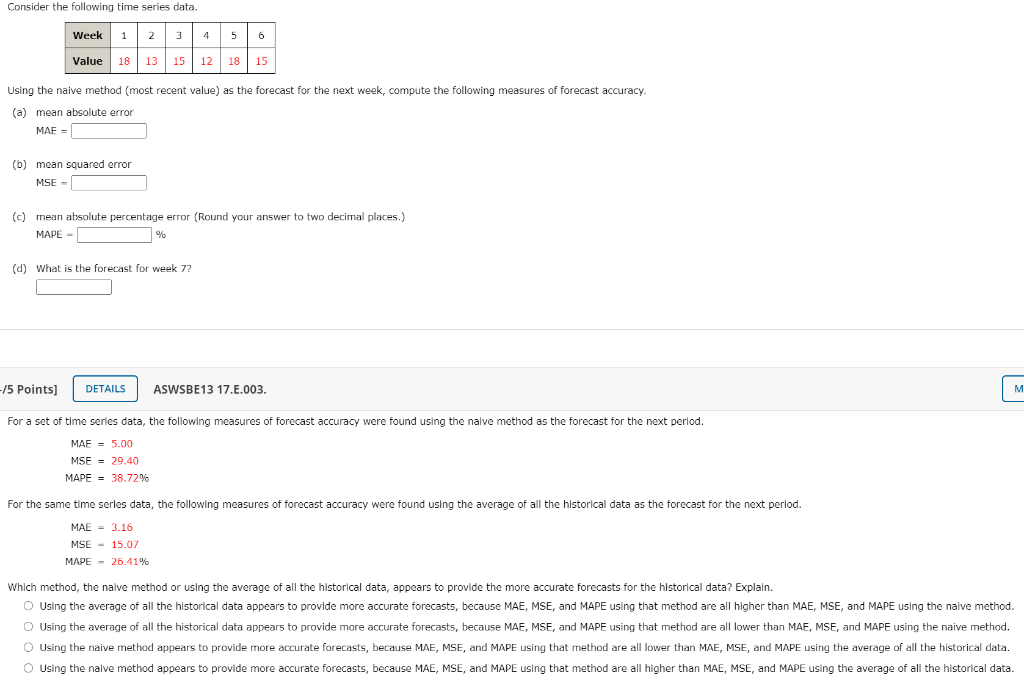
Consider the following time series data. Week 1 23 5 6 Value 18 13 15 12 18 15 Using the naive method (most recent value) as the forecast for the next week, compute the following measures of forecast accuracy. (a) mean absolute error MAE = (b) mean squared error MSE - (c) mean absolute percentage error (Round your answer to two decimal places.) MAPE (d) What is the forecast for week 7? -/5 Points] DETAILS ASWSBE13 17.E.003. M For a set of time series data, the following measures of forecast accuracy were found using the nalve method as the forecast for the next period. MAE = 5.00 MSE = 29.40 MAPE = 38.72% For the same time series data, the following measures of forecast accuracy were found using the average of all the historical data as the forecast for the next period. MAE = 3.16 MSE - 15.07 MAPE - 26.41% Which method, the nalve method or using the average of all the historical data, appears to provide the more accurate forecasts for the historical data? Explain. O Using the average of all the historical data appears to provide more accurate forecasts, because MAE, MSE, and MAPE using that method are all higher than MAE, MSE, and MAPE using the naive method. O Using the average of all the historical data appears to provide more accurate forecasts, because MAE, MSE, and MAPE using that method are all lower than MAE, MSE, and MAPE using the naive method. O Using the naive method appears to provide more accurate forecasts, because MAE, MSE, and MAPE using that method are all lower than MAE, MSE, and MAPE using the average of all the historical data. Using the naive method appears to provide more accurate forecasts, because MAE, MSE, and MAPE using that method are all higher than MAE, MSE, and MAPE using the average of all the historical data. Consider the following time series data. Week 1 23 5 6 Value 18 13 15 12 18 15 Using the naive method (most recent value) as the forecast for the next week, compute the following measures of forecast accuracy. (a) mean absolute error MAE = (b) mean squared error MSE - (c) mean absolute percentage error (Round your answer to two decimal places.) MAPE (d) What is the forecast for week 7? -/5 Points] DETAILS ASWSBE13 17.E.003. M For a set of time series data, the following measures of forecast accuracy were found using the nalve method as the forecast for the next period. MAE = 5.00 MSE = 29.40 MAPE = 38.72% For the same time series data, the following measures of forecast accuracy were found using the average of all the historical data as the forecast for the next period. MAE = 3.16 MSE - 15.07 MAPE - 26.41% Which method, the nalve method or using the average of all the historical data, appears to provide the more accurate forecasts for the historical data? Explain. O Using the average of all the historical data appears to provide more accurate forecasts, because MAE, MSE, and MAPE using that method are all higher than MAE, MSE, and MAPE using the naive method. O Using the average of all the historical data appears to provide more accurate forecasts, because MAE, MSE, and MAPE using that method are all lower than MAE, MSE, and MAPE using the naive method. O Using the naive method appears to provide more accurate forecasts, because MAE, MSE, and MAPE using that method are all lower than MAE, MSE, and MAPE using the average of all the historical data. Using the naive method appears to provide more accurate forecasts, because MAE, MSE, and MAPE using that method are all higher than MAE, MSE, and MAPE using the average of all the historical data
Step by Step Solution
There are 3 Steps involved in it

Get step-by-step solutions from verified subject matter experts