

Question: Consider the Jackson Network given in the figure below. There are three stations, each of which is an M/M/c system. The service rate of server
Consider the Jackson Network given in the figure below. There are three stations, each of which is an M/M/c system. The service rate of server in each station is given such that denotes the service rate of a server in station . Also, the numbers next to the arcs represent the probability of a customer choosing the arc.
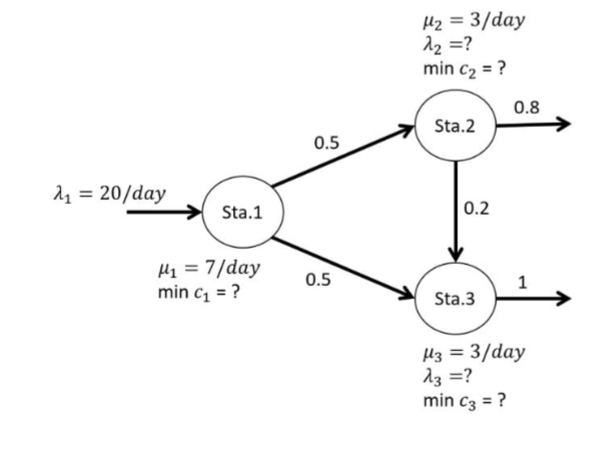
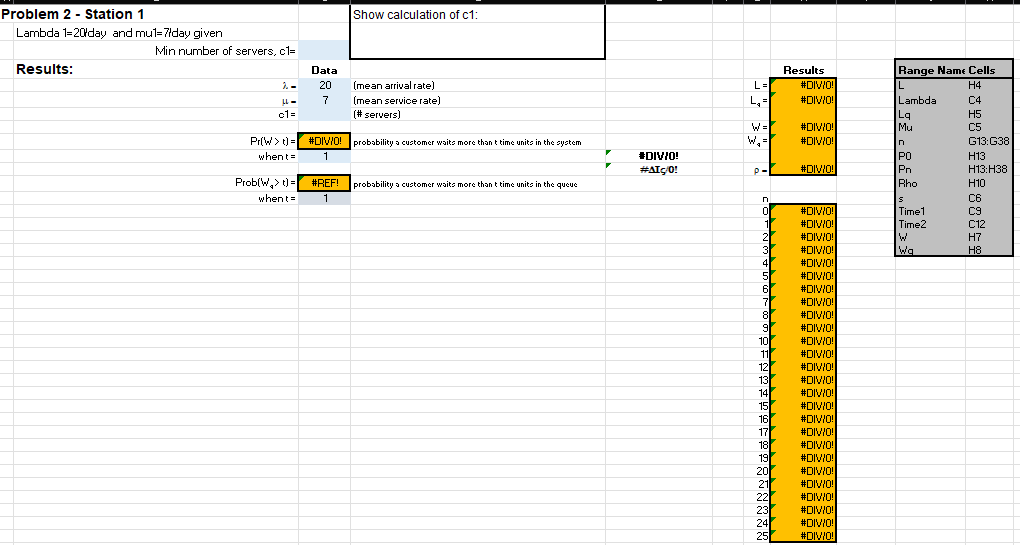
a) (0.5) Calculate the minimum number of servers needed in Station 1 for feasibility. More information can be found in the image below:
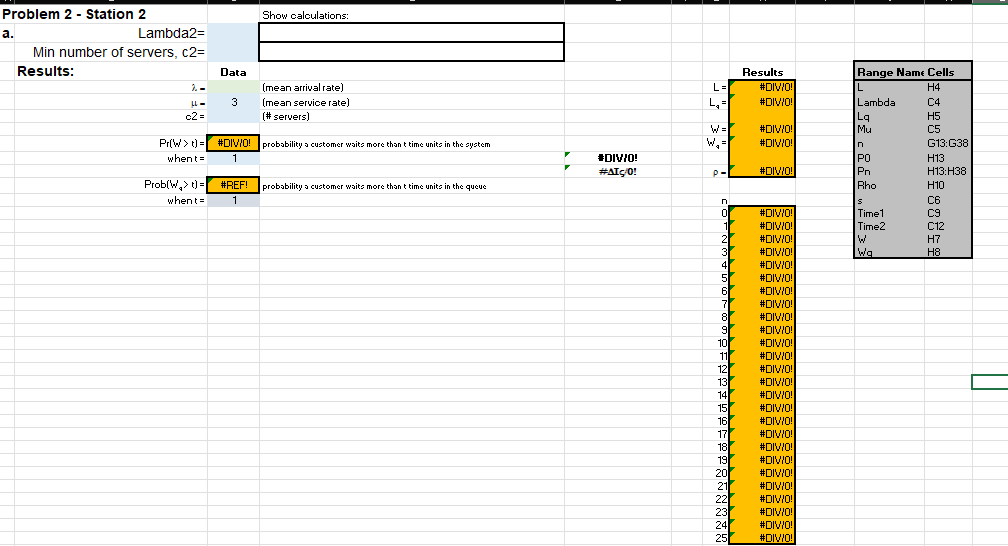
 b) (1.5 point) Calculate the arrival rate in station 2 and then calculate the minimum number of servers needed in Station 2 for feasibility. Show your calculations. More information can be found in the image below:
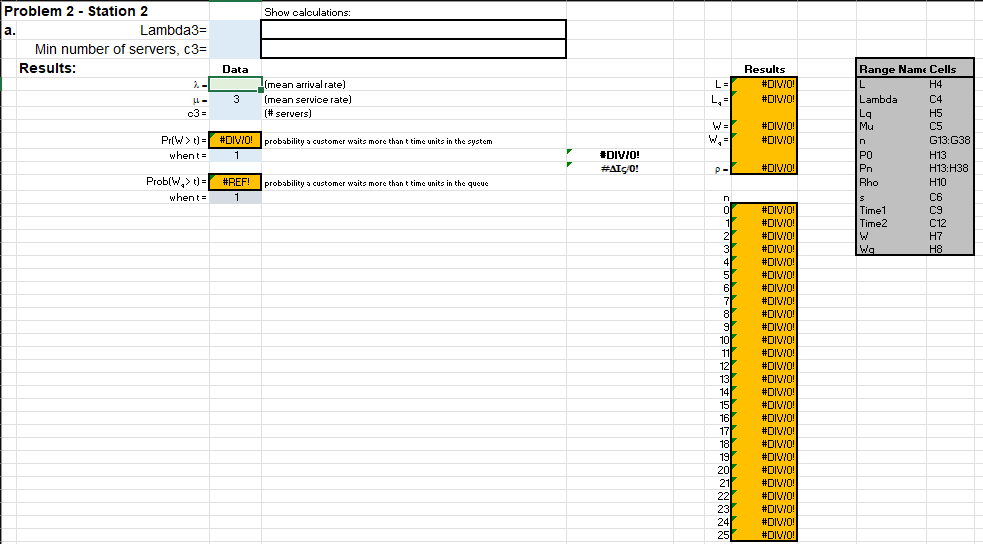
 c) (1.5 point) Calculate the arrival rate in station 3 and then calculate the minimum number of servers needed in Station 3 for feasibility. Show your calculations. More information can be found in the image below:
 d) (2 point) Using the key performance measures for each station from the templates, calculate the expected total number of customers in the network and expected amount of time a customer spends in the system. More information can be found in the image below:
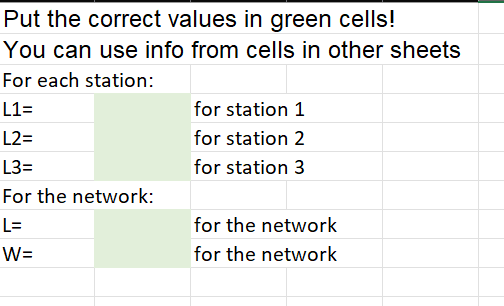
Problem 2 - Station 1 Show calculation of c1: Lambda 1=2 day and mul=71day given Min number of servers, c1= Results: \begin{tabular}{|ll|} \hline Range Hame Cells \\ \hline L & H4 \\ Lambda & C4 \\ Lq & H5 \\ Mu & C5 \\ n & G13:G38 \\ P0 & H13 \\ Pn & H13:H38 \\ Rho & H10 \\ s & C6 \\ Time1 & C \\ Time2 & C12 \\ W & H7 \\ WG & H8 \\ \hline \end{tabular} Problem 2 - Station 2 Show oaloulations: Lambda 2= Min number of servers, c2= Results: Problem 2 - Station 2 Show calculations: a. Min number of servers, c3= Results: Put the correct values in green cells! You can use info from cells in other sheets For each station: L1=L2=L3=forstation1forstation2forstation3 For the network: L=W=forthenetworkforthenetwork Problem 2 - Station 1 Show calculation of c1: Lambda 1=2 day and mul=71day given Min number of servers, c1= Results: \begin{tabular}{|ll|} \hline Range Hame Cells \\ \hline L & H4 \\ Lambda & C4 \\ Lq & H5 \\ Mu & C5 \\ n & G13:G38 \\ P0 & H13 \\ Pn & H13:H38 \\ Rho & H10 \\ s & C6 \\ Time1 & C \\ Time2 & C12 \\ W & H7 \\ WG & H8 \\ \hline \end{tabular} Problem 2 - Station 2 Show oaloulations: Lambda 2= Min number of servers, c2= Results: Problem 2 - Station 2 Show calculations: a. Min number of servers, c3= Results: Put the correct values in green cells! You can use info from cells in other sheets For each station: L1=L2=L3=forstation1forstation2forstation3 For the network: L=W=forthenetworkforthenetwork
Step by Step Solution
There are 3 Steps involved in it

Get step-by-step solutions from verified subject matter experts