

Question: Consider this normal distribution graph and the information below for the next two questions: 34.1% 34.1% Probability .40 .35 .30 .25 .20 .15 .10 .05
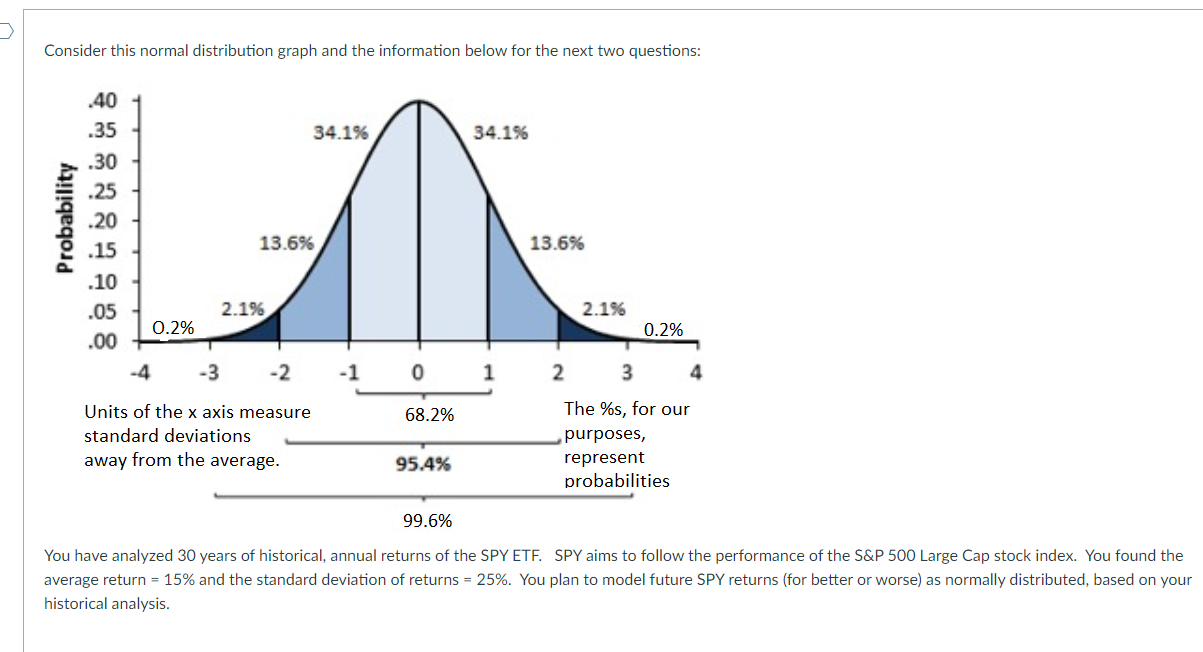
Consider this normal distribution graph and the information below for the next two questions: 34.1% 34.1% Probability .40 .35 .30 .25 .20 .15 .10 .05 .00 13.6% 13.6% 2.1% 2.1% 0.2% 0.2% -3 -2 0 1 2 3 4 68.2% Units of the x axis measure standard deviations away from the average. The %s, for our purposes, represent probabilities 95.4% 99.6% You have analyzed 30 years of historical, annual returns of the SPY ETF. SPY aims to follow the performance of the S&P 500 Large Cap stock index. You found the average return = 15% and the standard deviation of returns = 25%. You plan to model future SPY returns (for better or worse) as normally distributed, based on your historical analysis. When returns are measured annually, which two statements are true regarding Value at Risk (VaR)? The VaR return, or less, will be achieved about 10% of the time. On average, over the long haul, the VaR return or something worse will occur about once in 10 years. On average, over the long haul, the VaR return or something worse will occur about once in 20 years. Only one statement is true. In this case, this counts as the second correct answer. The VaR return, or less, will be achieved about 5% of the time. What is the probability that, in any given future year, the SPY return will be between -35% and + 40%? Consider this normal distribution graph and the information below for the next two questions: 34.1% 34.1% Probability .40 .35 .30 .25 .20 .15 .10 .05 .00 13.6% 13.6% 2.1% 2.1% 0.2% 0.2% -3 -2 0 1 2 3 4 68.2% Units of the x axis measure standard deviations away from the average. The %s, for our purposes, represent probabilities 95.4% 99.6% You have analyzed 30 years of historical, annual returns of the SPY ETF. SPY aims to follow the performance of the S&P 500 Large Cap stock index. You found the average return = 15% and the standard deviation of returns = 25%. You plan to model future SPY returns (for better or worse) as normally distributed, based on your historical analysis. When returns are measured annually, which two statements are true regarding Value at Risk (VaR)? The VaR return, or less, will be achieved about 10% of the time. On average, over the long haul, the VaR return or something worse will occur about once in 10 years. On average, over the long haul, the VaR return or something worse will occur about once in 20 years. Only one statement is true. In this case, this counts as the second correct answer. The VaR return, or less, will be achieved about 5% of the time. What is the probability that, in any given future year, the SPY return will be between -35% and + 40%
Step by Step Solution
There are 3 Steps involved in it

Get step-by-step solutions from verified subject matter experts