

Question: Consider this normal distribution graph and the information below for the next two questions: 34.1% Probability 40 .35 34.1% .30 25 .20 .15 13.6% .10
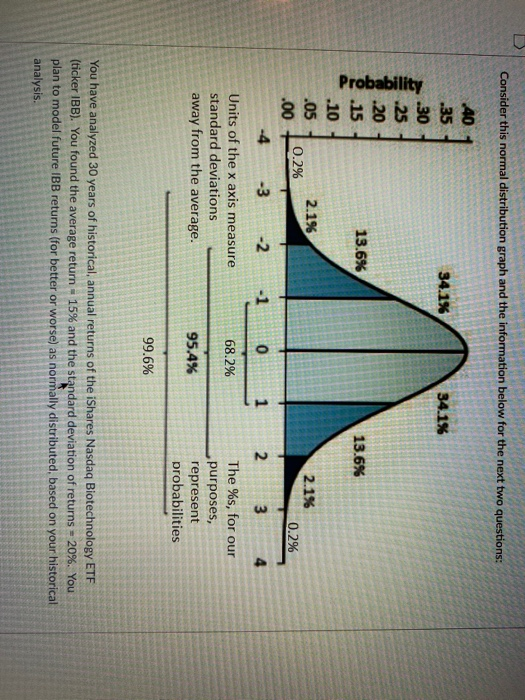
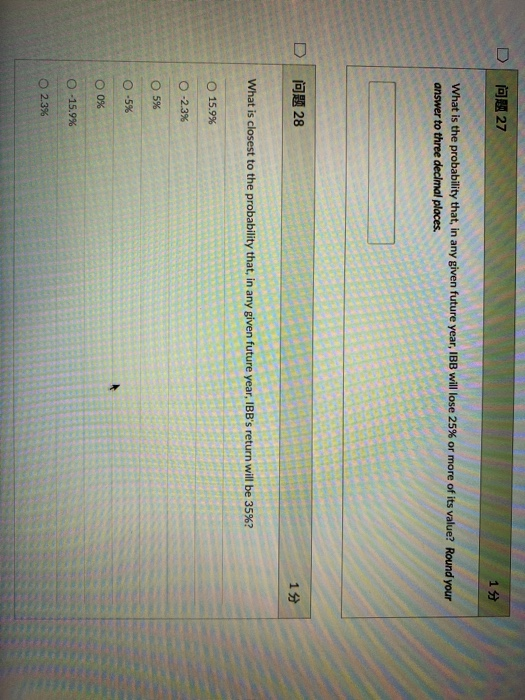
Consider this normal distribution graph and the information below for the next two questions: 34.1% Probability 40 .35 34.1% .30 25 .20 .15 13.6% .10 .05 2.1% 0.2% .00 -4 -3 -2 -1 13.6% 2.1% 0.2% 0 68.2% Units of the x axis measure standard deviations away from the average. 2 3 4 The %s, for our purposes, represent probabilities 95.4% 99.6% You have analyzed 30 years of historical, annual returns of the iShares Nasdaq Biotechnology ETF (ticker 1BB). You found the average return -15% and the standard deviation of returns - 20%. You plan to model future IBB returns (for better or worse) as normally distributed, based on your historical analysis. U a 27 15 What is the probability that, in any given future year, IBB will lose 25% or more of its value? Round your answer to three decimal places. D 1028 14 What is closest to the probability that, in any given future year, IBB's return will be 35%? 15.9% O -2.3% O 5% O -5% O 0% 0 -15.9% O 2.3%
Step by Step Solution
There are 3 Steps involved in it

Get step-by-step solutions from verified subject matter experts