

Question: D Consider this normal distribution graph and the information below for the next two questions 34.1% Probability .40 .35 34.15 .30 .25 20 .15 13.6%
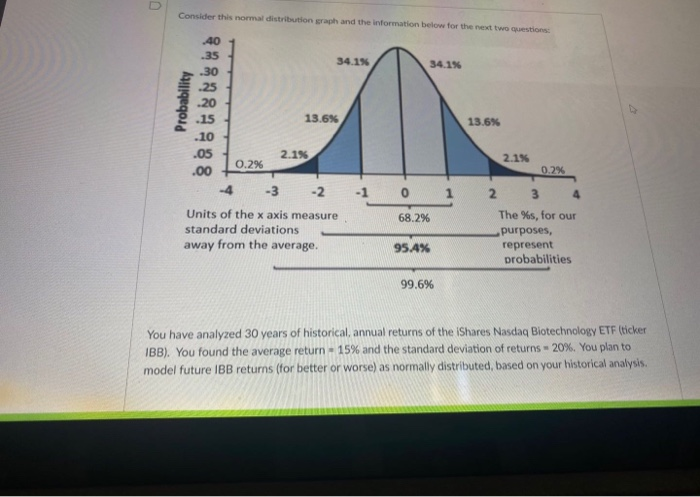
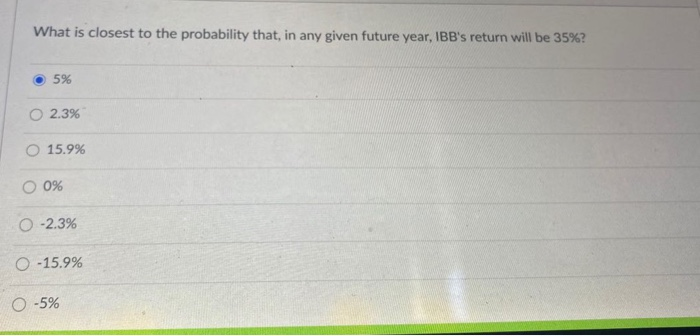
D Consider this normal distribution graph and the information below for the next two questions 34.1% Probability .40 .35 34.15 .30 .25 20 .15 13.6% .10 .05 2.1% 0.2% .00 -4 -3 -2 -1 13.6% 2.1% 0.2% 0 1 68.2% Units of the x axis measure standard deviations away from the average. 2 3 4 The %s, for our purposes, represent probabilities 95.4% 99.6% You have analyzed 30 years of historical, annual returns of the Shares Nasdaq Biotechnology ETF (ticker IBB). You found the average return -15% and the standard deviation of returns 20%. You plan to model future IBB returns (for better or worse) as normally distributed, based on your historical analysis. What is closest to the probability that, in any given future year, IBB's return will be 35%? 5% O 2.3% O 15.9% 0% 0 -2.3% 0 -15.9% 0 -5%
Step by Step Solution
There are 3 Steps involved in it

Get step-by-step solutions from verified subject matter experts