

Question: Consider this normal distribution graph and the information below for the next two questions. ( Hint: These questions illustrate how you might see numerical Normal
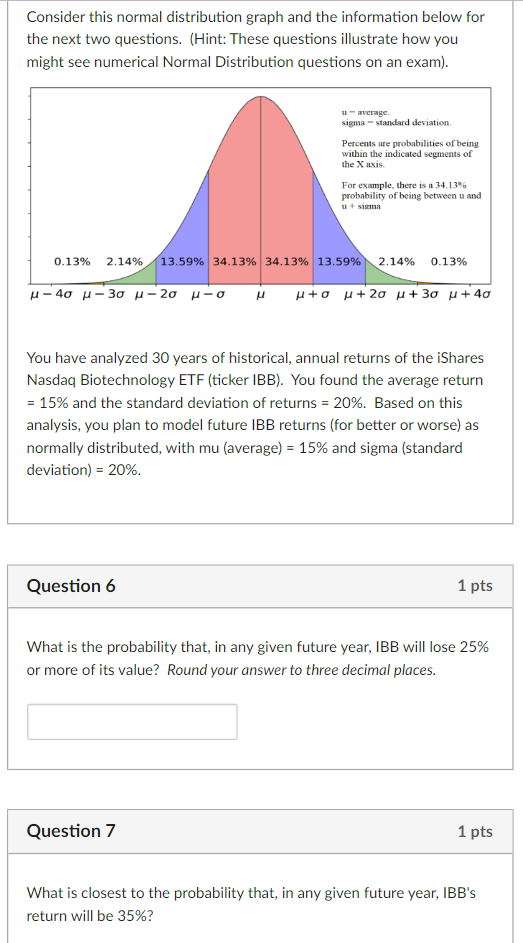
Consider this normal distribution graph and the information below for
the next two questions. Hint: These questions illustrate how you
might see numerical Normal Distribution questions on an exam
You have analyzed years of historical, annual returns of the iShares
Nasdaq Biotechnology ETF ticker IBB You found the average return
and the standard deviation of returns Based on this
analysis, you plan to model future IBB returns for better or worse as
normally distributed, with mu average and sigma standard
deviation
Question
What is the probability that, in any given future year, IBB will lose
or more of its value? Round your answer to three decimal places.
Question
What is closest to the probability that, in any given future year, IBB's
return will be
Step by Step Solution
There are 3 Steps involved in it
1 Expert Approved Answer
Step: 1 Unlock

Question Has Been Solved by an Expert!
Get step-by-step solutions from verified subject matter experts
Step: 2 Unlock
Step: 3 Unlock