

Question: Consider this plot, where each blue point is a possible portfolio of stocks. The return and the risk are calculated at monthly frequency. What is
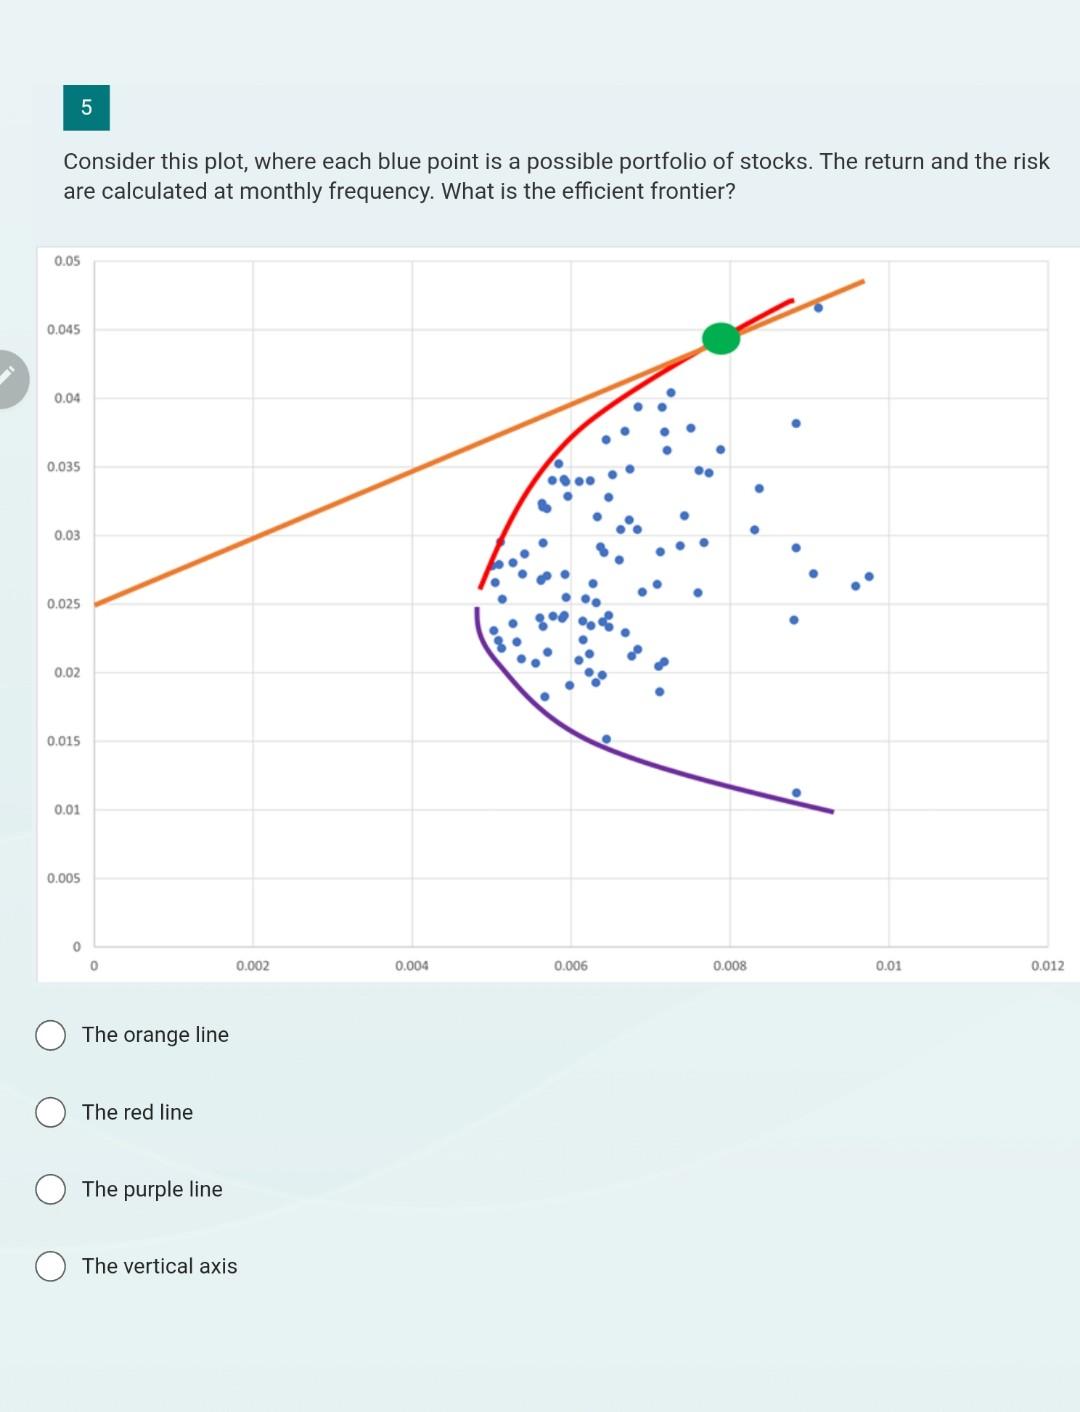
Consider this plot, where each blue point is a possible portfolio of stocks. The return and the risk are calculated at monthly frequency. What is the efficient frontier? The orange line The red line The purple line The vertical axis
Step by Step Solution
There are 3 Steps involved in it
1 Expert Approved Answer
Step: 1 Unlock

Question Has Been Solved by an Expert!
Get step-by-step solutions from verified subject matter experts
Step: 2 Unlock
Step: 3 Unlock