

Question: Consider this plot, where each blue point is a possible portfolio of stocks. The return and the risk are calculated at monthly frequency. What is
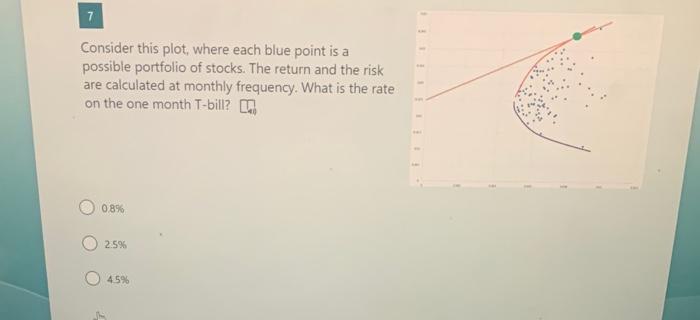
Consider this plot, where each blue point is a possible portfolio of stocks. The return and the risk are calculated at monthly frequency. What is the rate on the one month T-bill? 0.8% 2.5% 45% Consider this plot, where each blue point is a possible portfolio of stocks. The return and the risk are calculated at monthly frequency. What is the rate on the one month T-bill? 0.8% 2.5% 45%
Step by Step Solution
There are 3 Steps involved in it
1 Expert Approved Answer
Step: 1 Unlock

Question Has Been Solved by an Expert!
Get step-by-step solutions from verified subject matter experts
Step: 2 Unlock
Step: 3 Unlock