

Question: Refer to Table SQ.1 - Factors for Computing Control Chart Limits (3 sigma) for this problem. Sampling 4 pieces of precision-cut wire (to be used
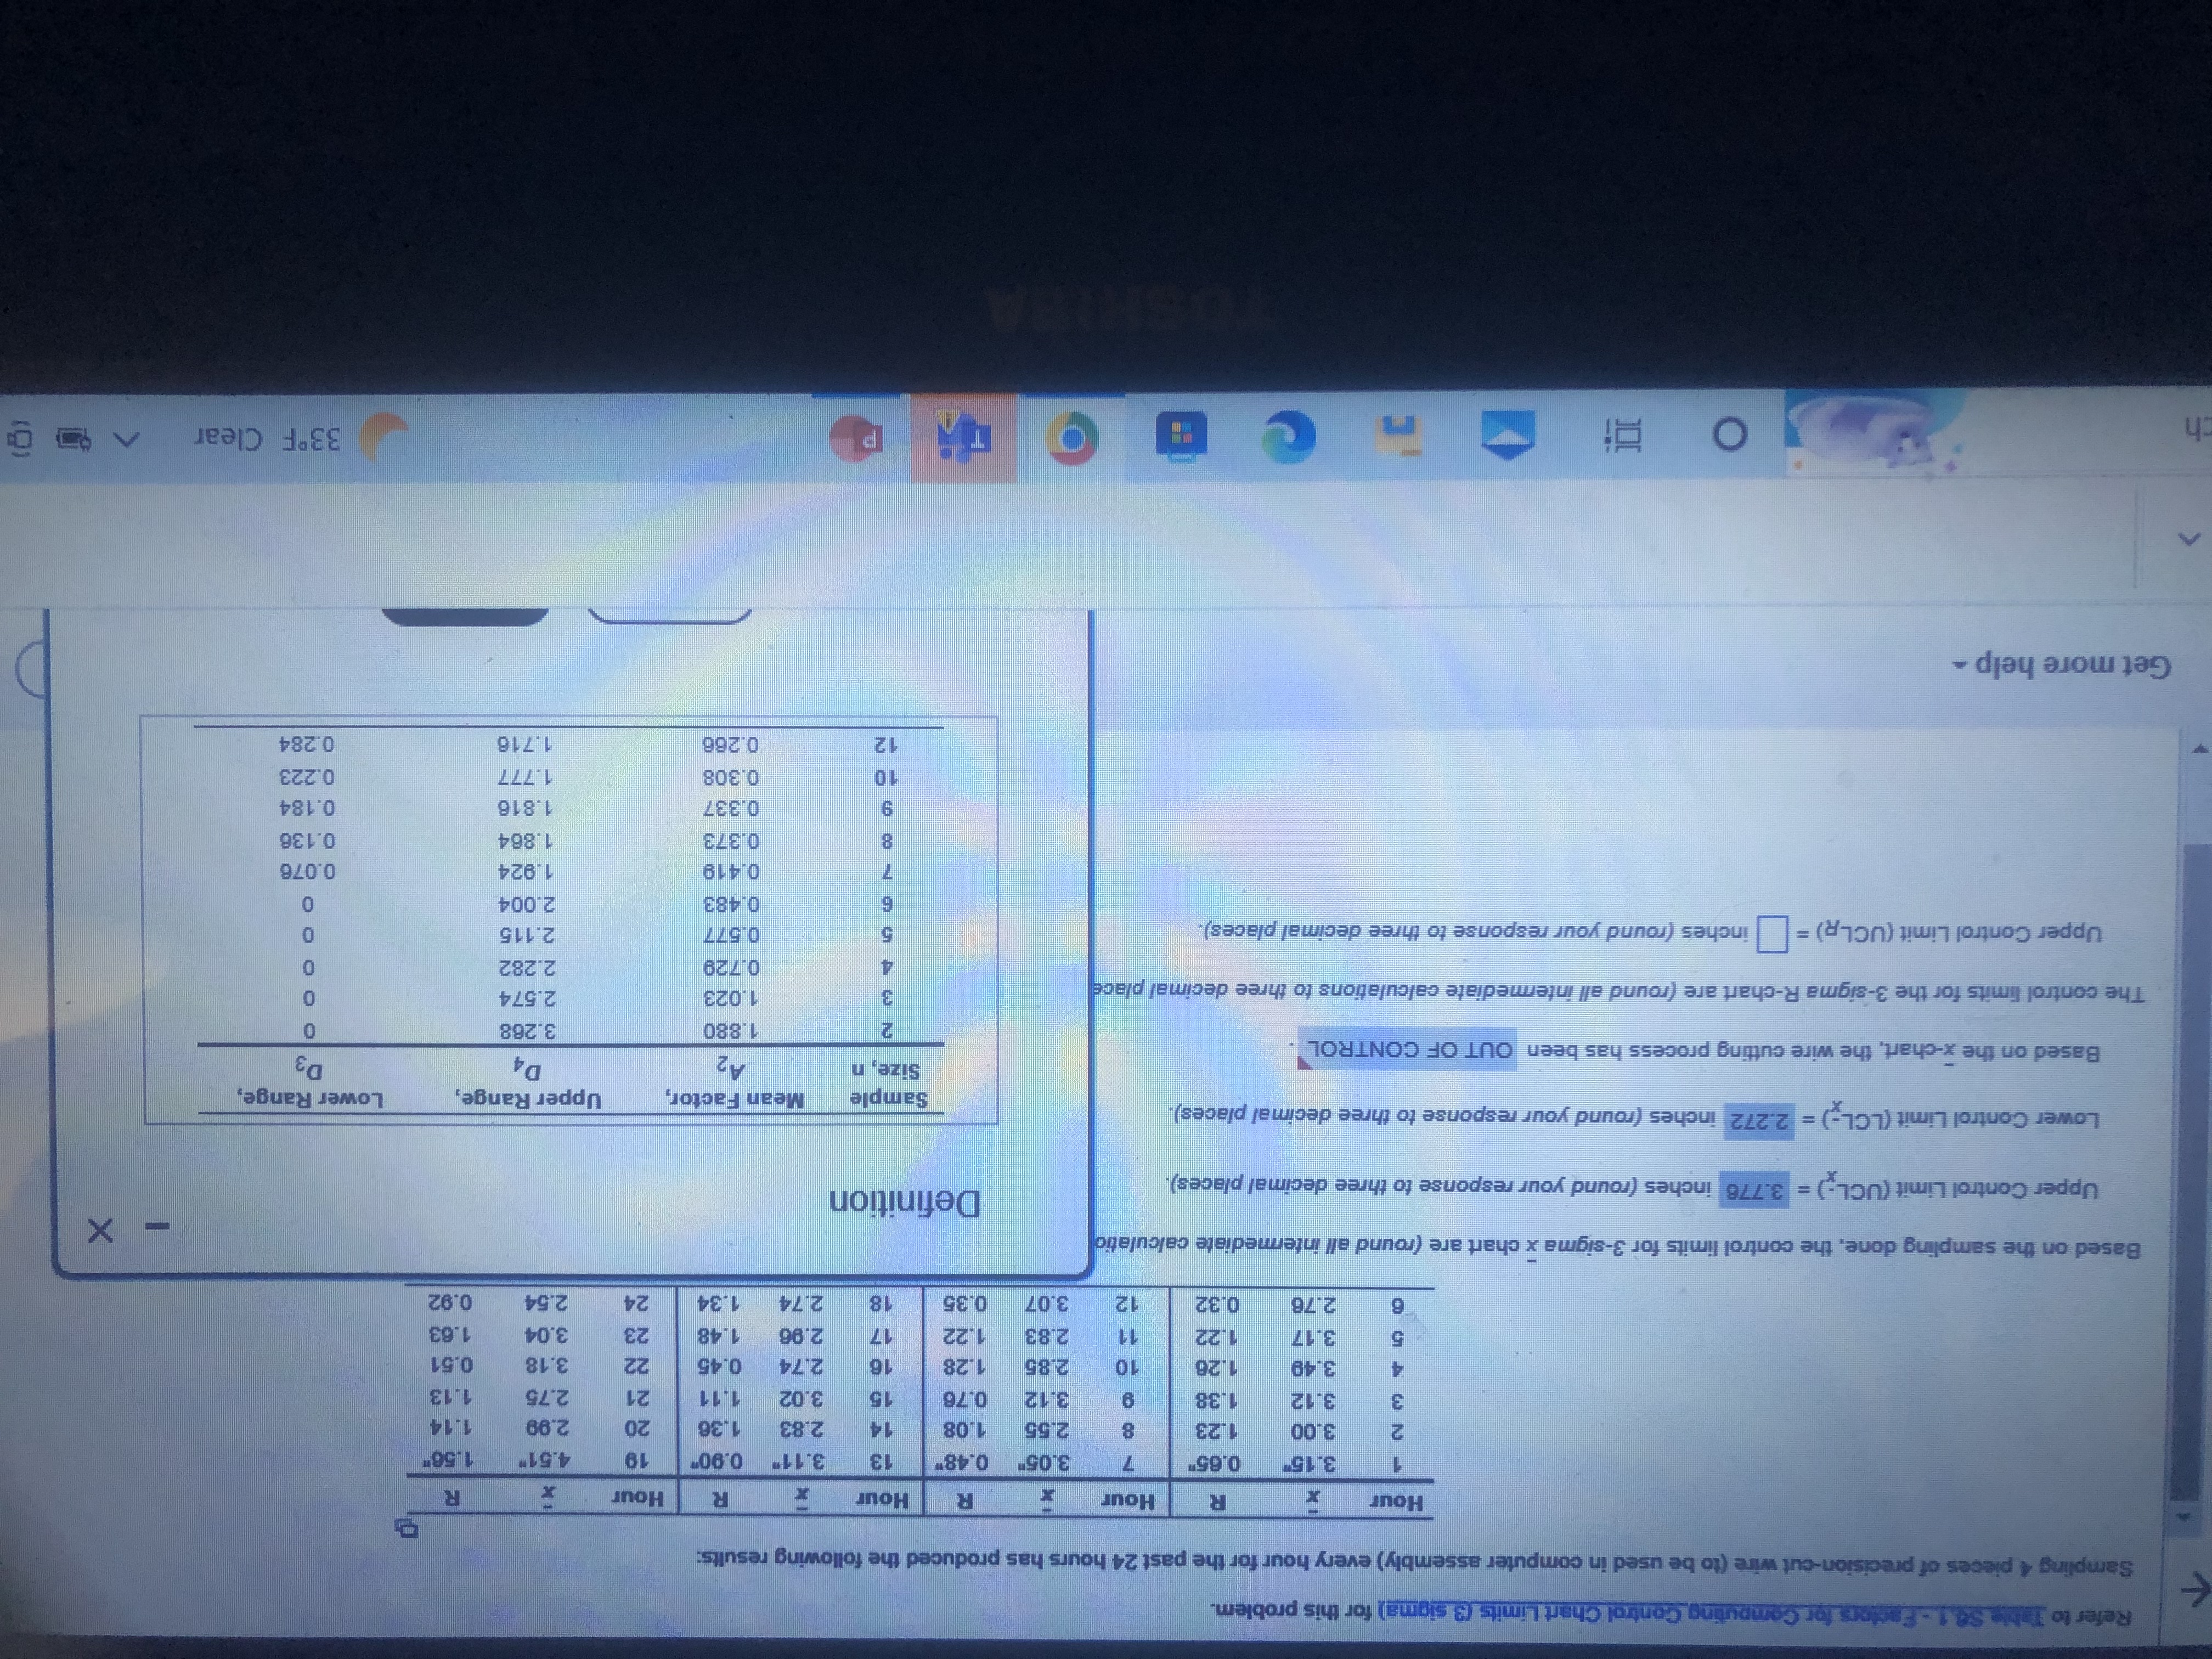
Refer to Table SQ.1 - Factors for Computing Control Chart Limits (3 sigma) for this problem. Sampling 4 pieces of precision-cut wire (to be used in computer assembly) every hour for the past 24 hours has produced the following results: Hour x R Hour R Hour R Hour R 3.15" 0.65' 3.05" 0.48" 13 3.11" 0.90" 19 4.51 1.56" 3.00 1.23 2.55 1.08 14 2.83 1.36 20 2.99 1.14 3 3.12 1.38 3.12 0.7 15 3 02 1.11 21 2.75 1.13 4 3.49 1.26 10 2.85 1.28 16 2.74 0.45 22 3.18 0.51 15 3.17 1.22 11 2.8 1.22 17 2.96 1.48 23 3.04 1.63 2.78 0.32 12 3.07 0.35 18 2.74 1.34 24 2.54 0.92 Based on the sampling done, the control limits for 3-sigma x chart are (round all intermediate calculation X Upper Control Limit (UCL;) = 3.776 inches (round your response to three decimal places) Definition Lower Control Limit (LCL-) = 2.272 inches (round your response to three decimal places). Sample Mean Factor, Upper Range, Lower Range, Size, n A2 DA D3 Based on the x-chart, the wire cutting process has been OUT OF CONTROL . 1.880 3.268 The control limits for the 3-sigma R-chart are (round all intermediate calculations to three decimal place 1.023 2.574 0 0.729 2.282 0 Upper Control Limit (UCLR) = inches (round your response to three decimal places). 0.577 2.115 0 0.483 2.004 0 0.419 1.924 0.076 0.373 1.864 0.136 0.337 1.816 0.184 10 0.308 1.777 0.223 0.266 1.716 0.284 Get more help - O O T 33.F Clear
Step by Step Solution
There are 3 Steps involved in it

Get step-by-step solutions from verified subject matter experts