

Question: Control Chart Table Sample Size (n) Factor for X-Chart A2 Factors for R-Chart D3 D4 orow 2 3 4 5 6 7 8 9 10
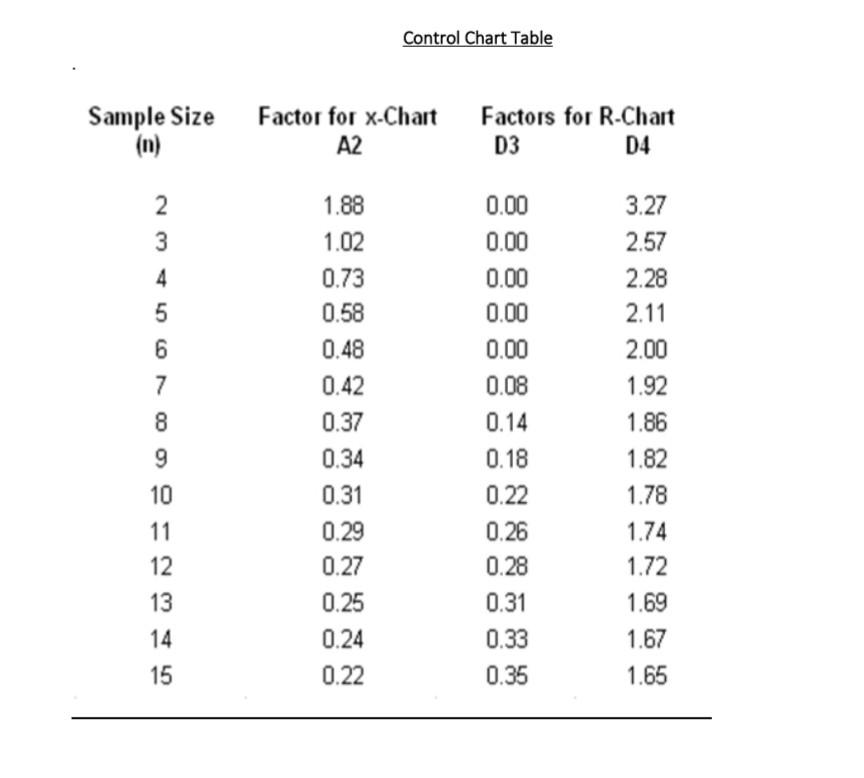
Control Chart Table Sample Size (n) Factor for X-Chart A2 Factors for R-Chart D3 D4 orow 2 3 4 5 6 7 8 9 10 11 1.88 1.02 0.73 0.58 0.48 0.42 0.37 0.34 0.31 0.29 0.27 0.25 0.24 0.22 0.00 0.00 0.00 0.00 0.00 0.08 0.14 0.18 0.22 0.26 0.28 0.31 0.33 0.35 3.27 2.57 2.28 2.11 2.00 1.92 1.86 1.82 1.78 1.74 1.72 1.69 1.67 1.65 12 13 14 15 Control Chart Table Sample Size (n) Factor for X-Chart A2 Factors for R-Chart D3 D4 orow 2 3 4 5 6 7 8 9 10 11 1.88 1.02 0.73 0.58 0.48 0.42 0.37 0.34 0.31 0.29 0.27 0.25 0.24 0.22 0.00 0.00 0.00 0.00 0.00 0.08 0.14 0.18 0.22 0.26 0.28 0.31 0.33 0.35 3.27 2.57 2.28 2.11 2.00 1.92 1.86 1.82 1.78 1.74 1.72 1.69 1.67 1.65 12 13 14 15
Step by Step Solution
There are 3 Steps involved in it
1 Expert Approved Answer
Step: 1 Unlock

Question Has Been Solved by an Expert!
Get step-by-step solutions from verified subject matter experts
Step: 2 Unlock
Step: 3 Unlock