

Question: Control charts for 9? and R are maintained for an important quality characteristic. The sample size is n = 8. a? and R are computed
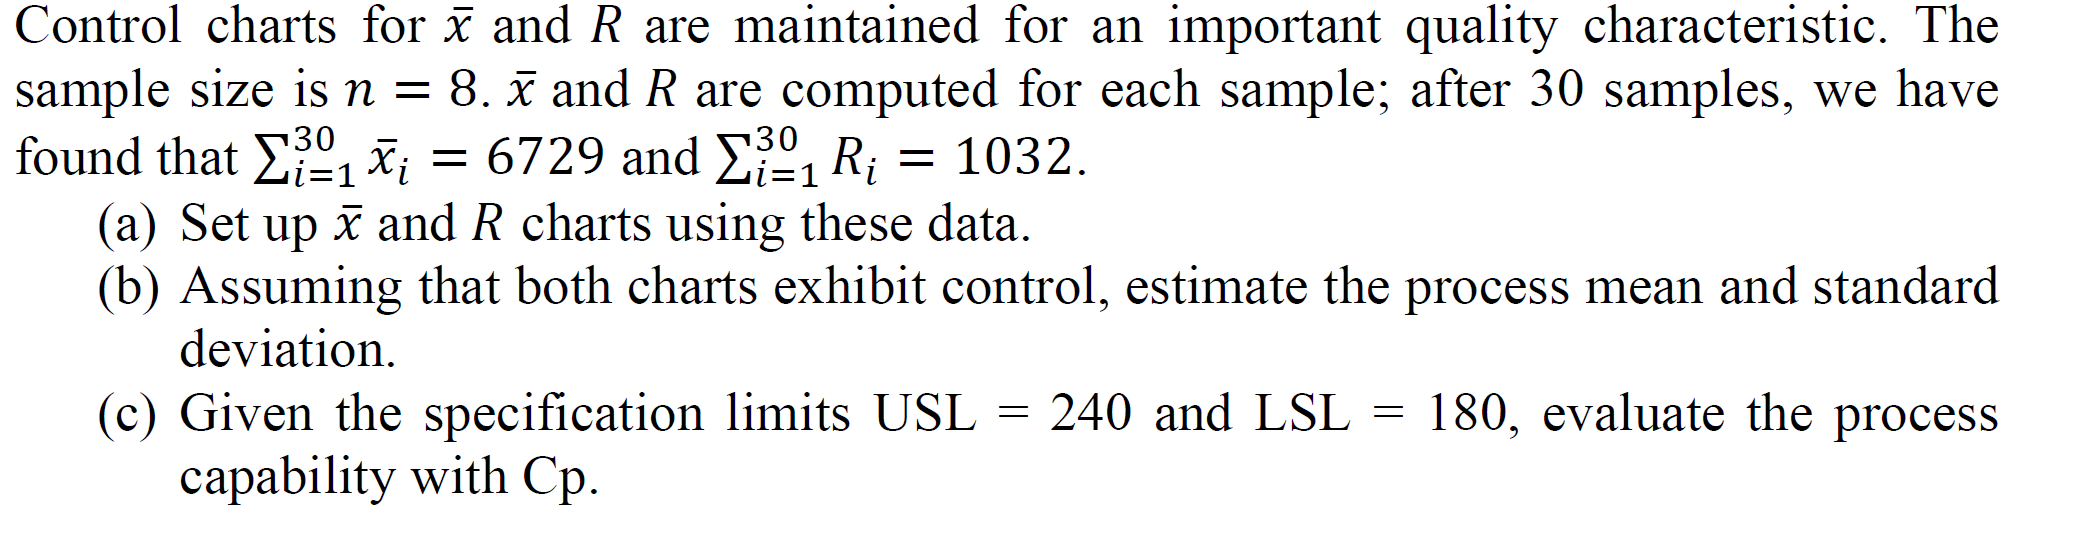

Control charts for 9? and R are maintained for an important quality characteristic. The sample size is n = 8. a? and R are computed for each sample; after 30 samples, we have found that 2:21 3?!- = 6729 and 21321 Ri = 1032. (a) Set up a? and R charts using these data. (b) Assuming that both charts exhibit control, estimate the process mean and standard deviation. (c) Given the specication limits USL = 240 and LSL = 180, evaluate the process capability with Cp
Step by Step Solution
There are 3 Steps involved in it
1 Expert Approved Answer
Step: 1 Unlock

Question Has Been Solved by an Expert!
Get step-by-step solutions from verified subject matter experts
Step: 2 Unlock
Step: 3 Unlock