

Question: ppplease answer clrealry without using any softwar Control charts for f and R are maintained for an important quality characteristic. The sample size is n
ppplease answer clrealry without using any softwar
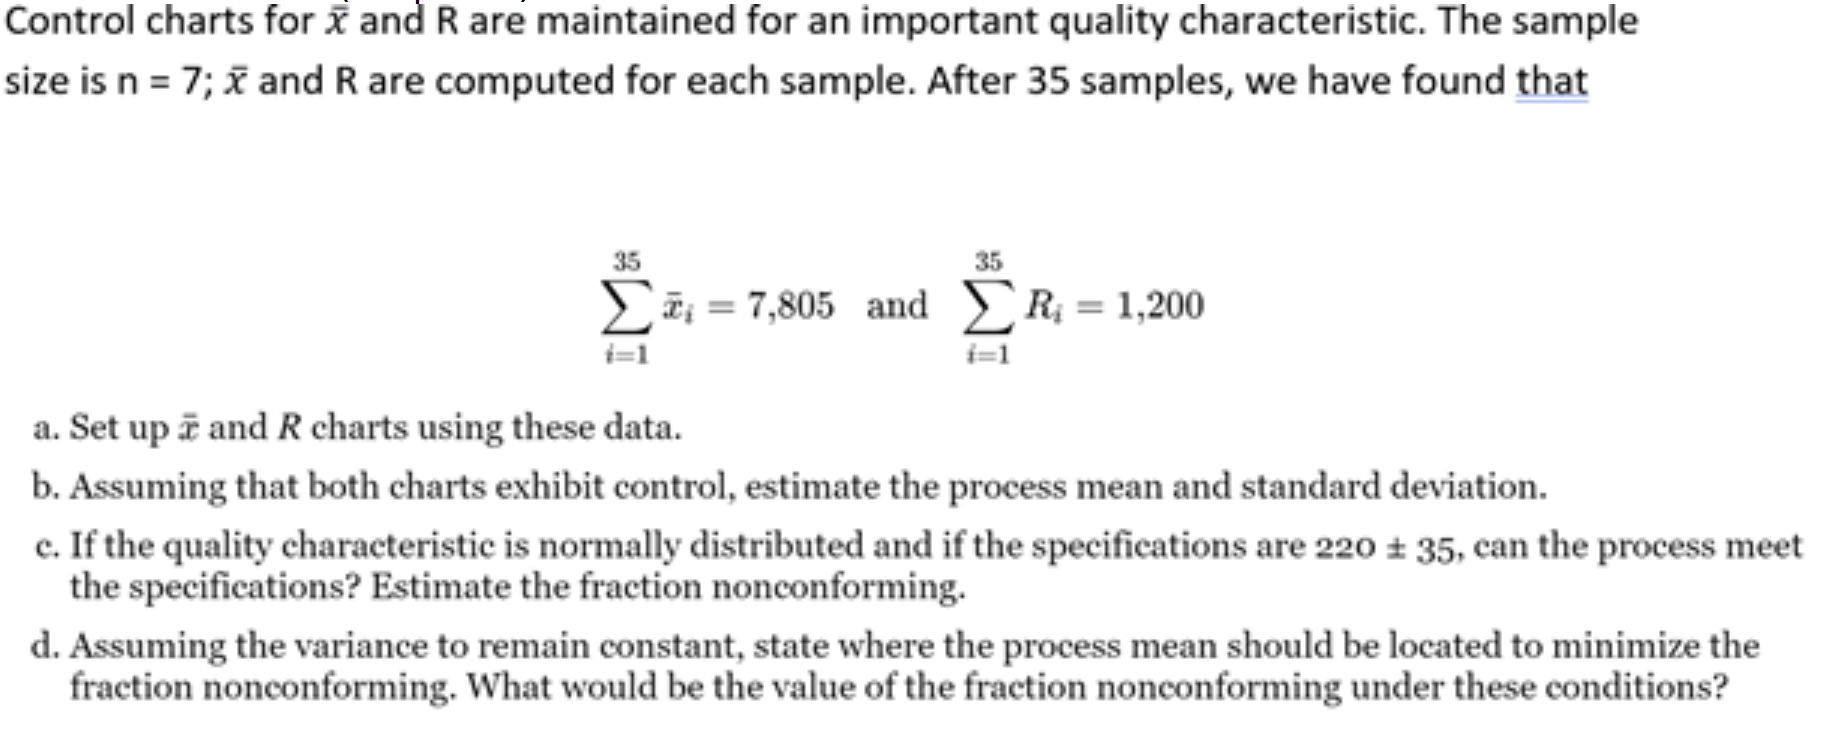
Control charts for f and R are maintained for an important quality characteristic. The sample size is n . 7; J? and R are computed for each sample. After 35 samples, we have found mix as as 25, = 7,805 and ER. = 1,200 '=I {=1 11. Set up 5: and R charts using these data. b. Assuming that both charts exhibit control. estimate the process mean and standard deviation. c. If the quality characteristic is normally distributed and if the specications are 220 s 35. can the process meet the specications? Estimate the fraction nonconforming. d. Assuming the variance to remain constant, state where the process mean should be located to minimize the fraction nonconforming. What would be the value of the fraction nonconforming under these conditions
Step by Step Solution
There are 3 Steps involved in it

Get step-by-step solutions from verified subject matter experts