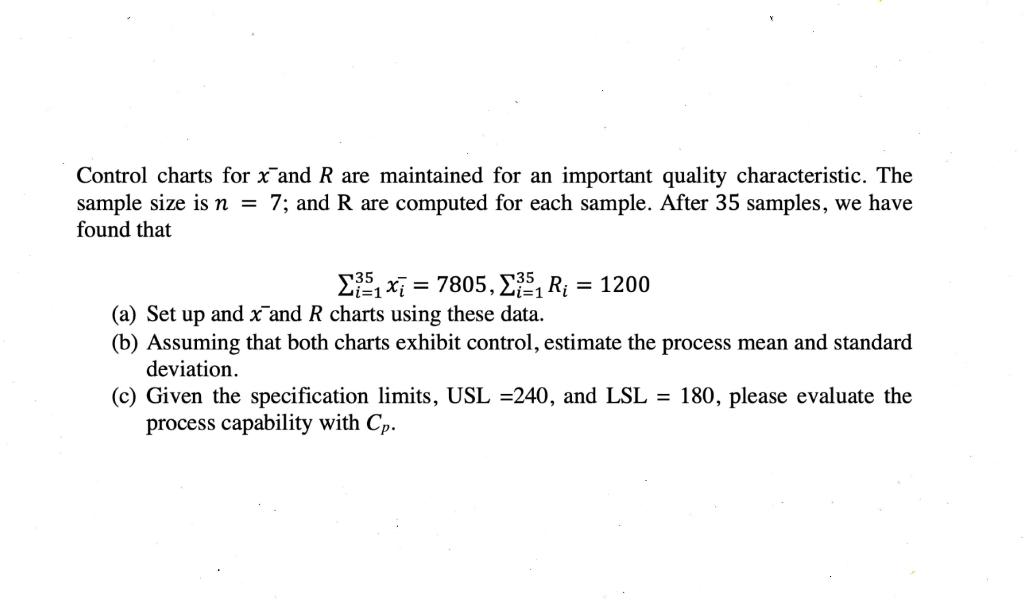
Question: Control charts for x and R are maintained for an important quality characteristic. The sample size is n = 7; and R are computed for

Control charts for x and R are maintained for an

Control charts for x and R are maintained for an important quality characteristic. The sample size is n = 7; and R are computed for each sample. After 35 samples, we have found that = 7805, , R; = 1200 (a) Set up and x and R charts using these data. (b) Assuming that both charts exhibit control, estimate the process mean and standard deviation. (c) Given the specification limits, USL =240, and LSL = 180, please evaluate the process capability with Cp

Step by Step Solution

There are 3 Steps involved in it

1 Expert Approved Answer
Step: 1 Unlock blur-text-image
Question Has Been Solved by an Expert!

Get step-by-step solutions from verified subject matter experts

Step: 2 Unlock
Step: 3 Unlock

Students Have Also Explored These Related General Management Questions!