

Question: Control charts, specifically the x bar ( x ) and R charts, are often used in statistical process control ( SPC ) to monitor the
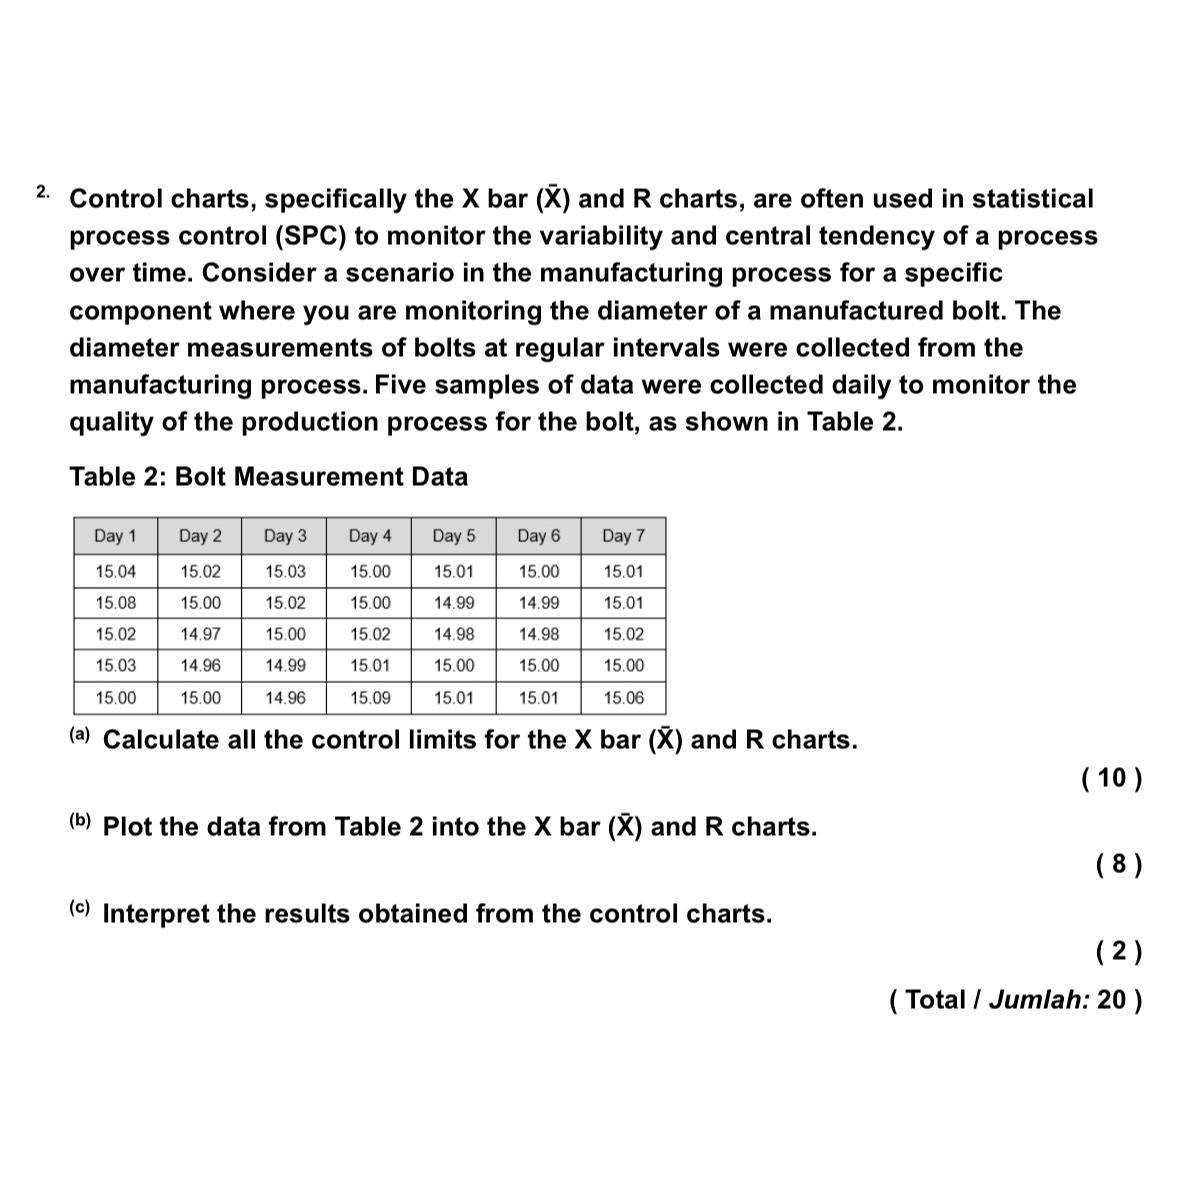
Control charts, specifically the bar and charts, are often used in statistical process control SPC to monitor the variability and central tendency of a process over time. Consider a scenario in the manufacturing process for a specific component where you are monitoring the diameter of a manufactured bolt. The diameter measurements of bolts at regular intervals were collected from the manufacturing process. Five samples of data were collected daily to monitor the quality of the production process for the bolt, as shown in Table
Table : Bolt Measurement Data
tableDay Day Day Day Day Day Day
a Calculate all the control limits for the bar and charts.
b Plot the data from Table into the bar and charts.
c Interpret the results obtained from the control charts.
Total Jumlah:
Step by Step Solution
There are 3 Steps involved in it
1 Expert Approved Answer
Step: 1 Unlock

Question Has Been Solved by an Expert!
Get step-by-step solutions from verified subject matter experts
Step: 2 Unlock
Step: 3 Unlock