

Question: Could you please explain and comment on the data characteristics in detail based on the results I got from time series plot and ACF plots.
Could you please explain and comment on the data characteristics in detail based on the results I got from time series plot and ACF plots.
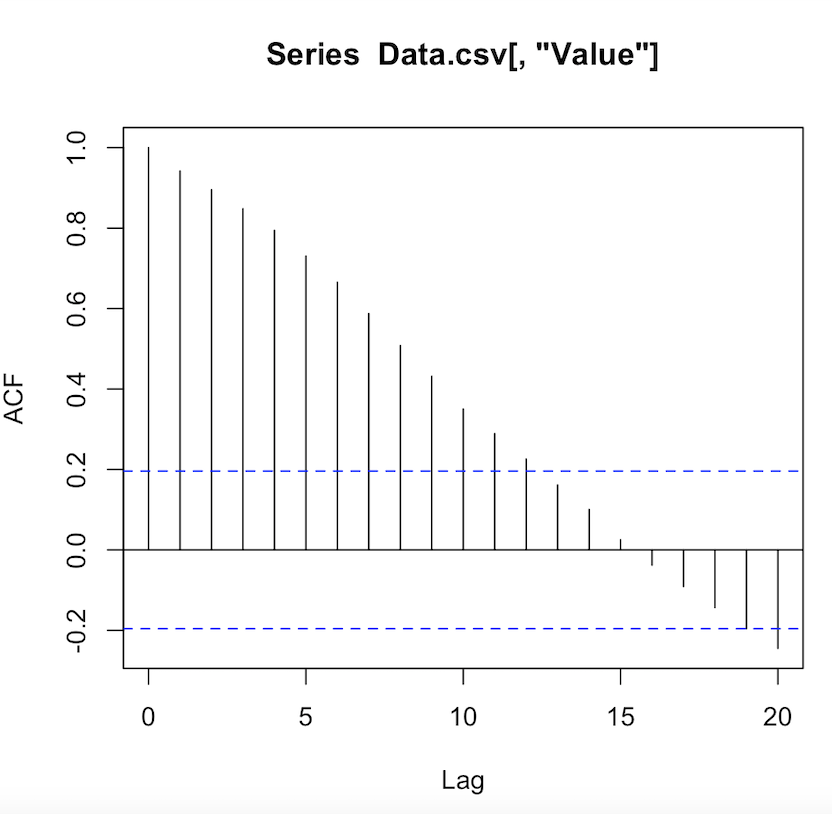
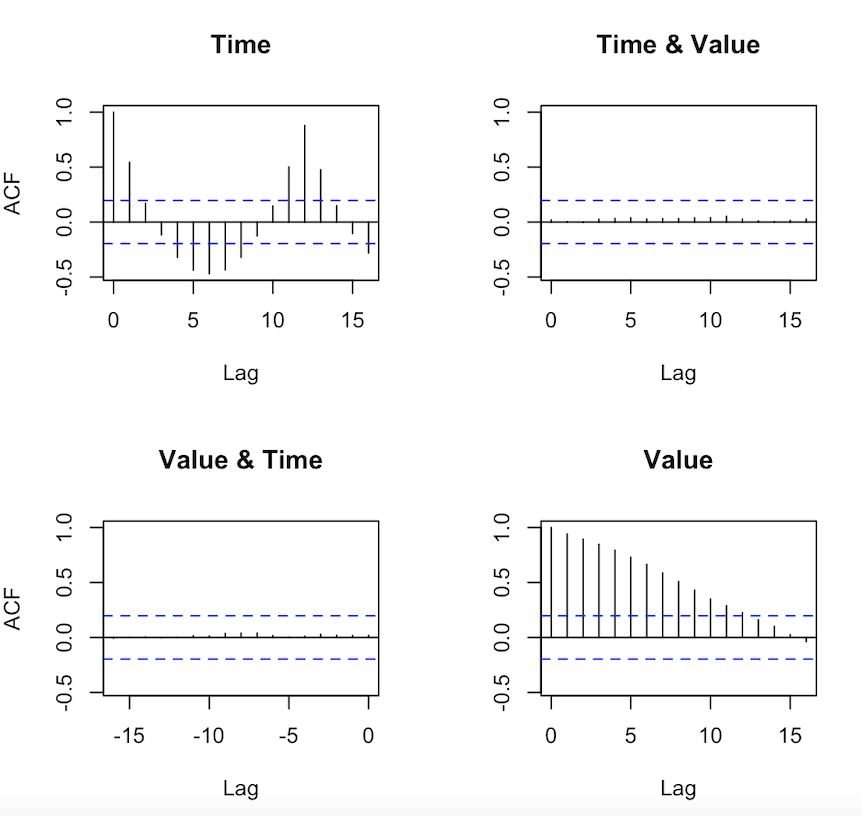
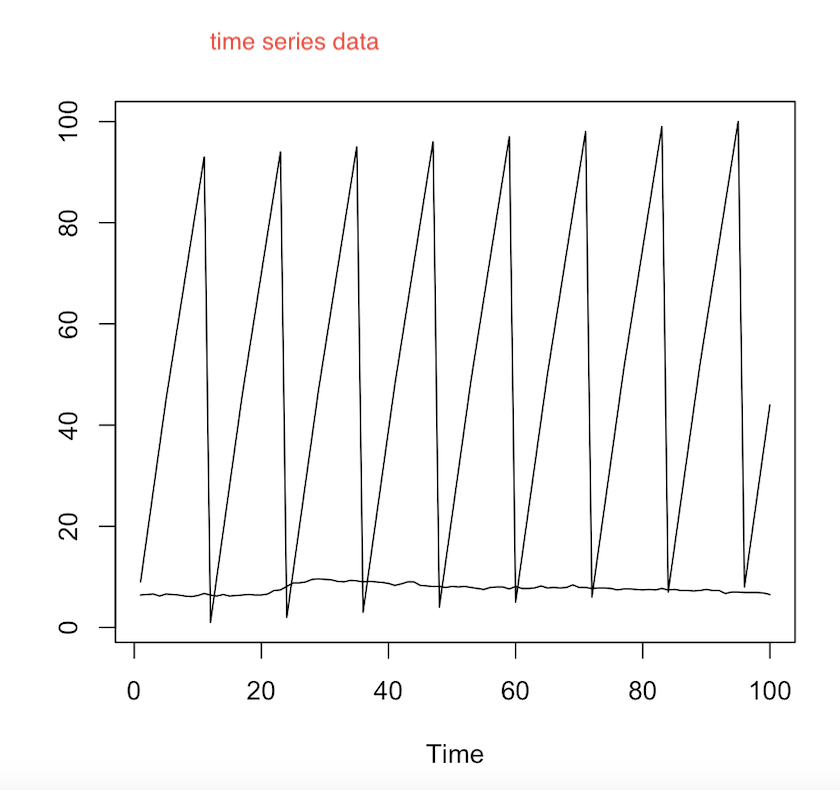
I have attached 3 pictures, could you please explain these datas characteristics in detail? (stationary or non-stationary). Thank you very much for your time in advance!
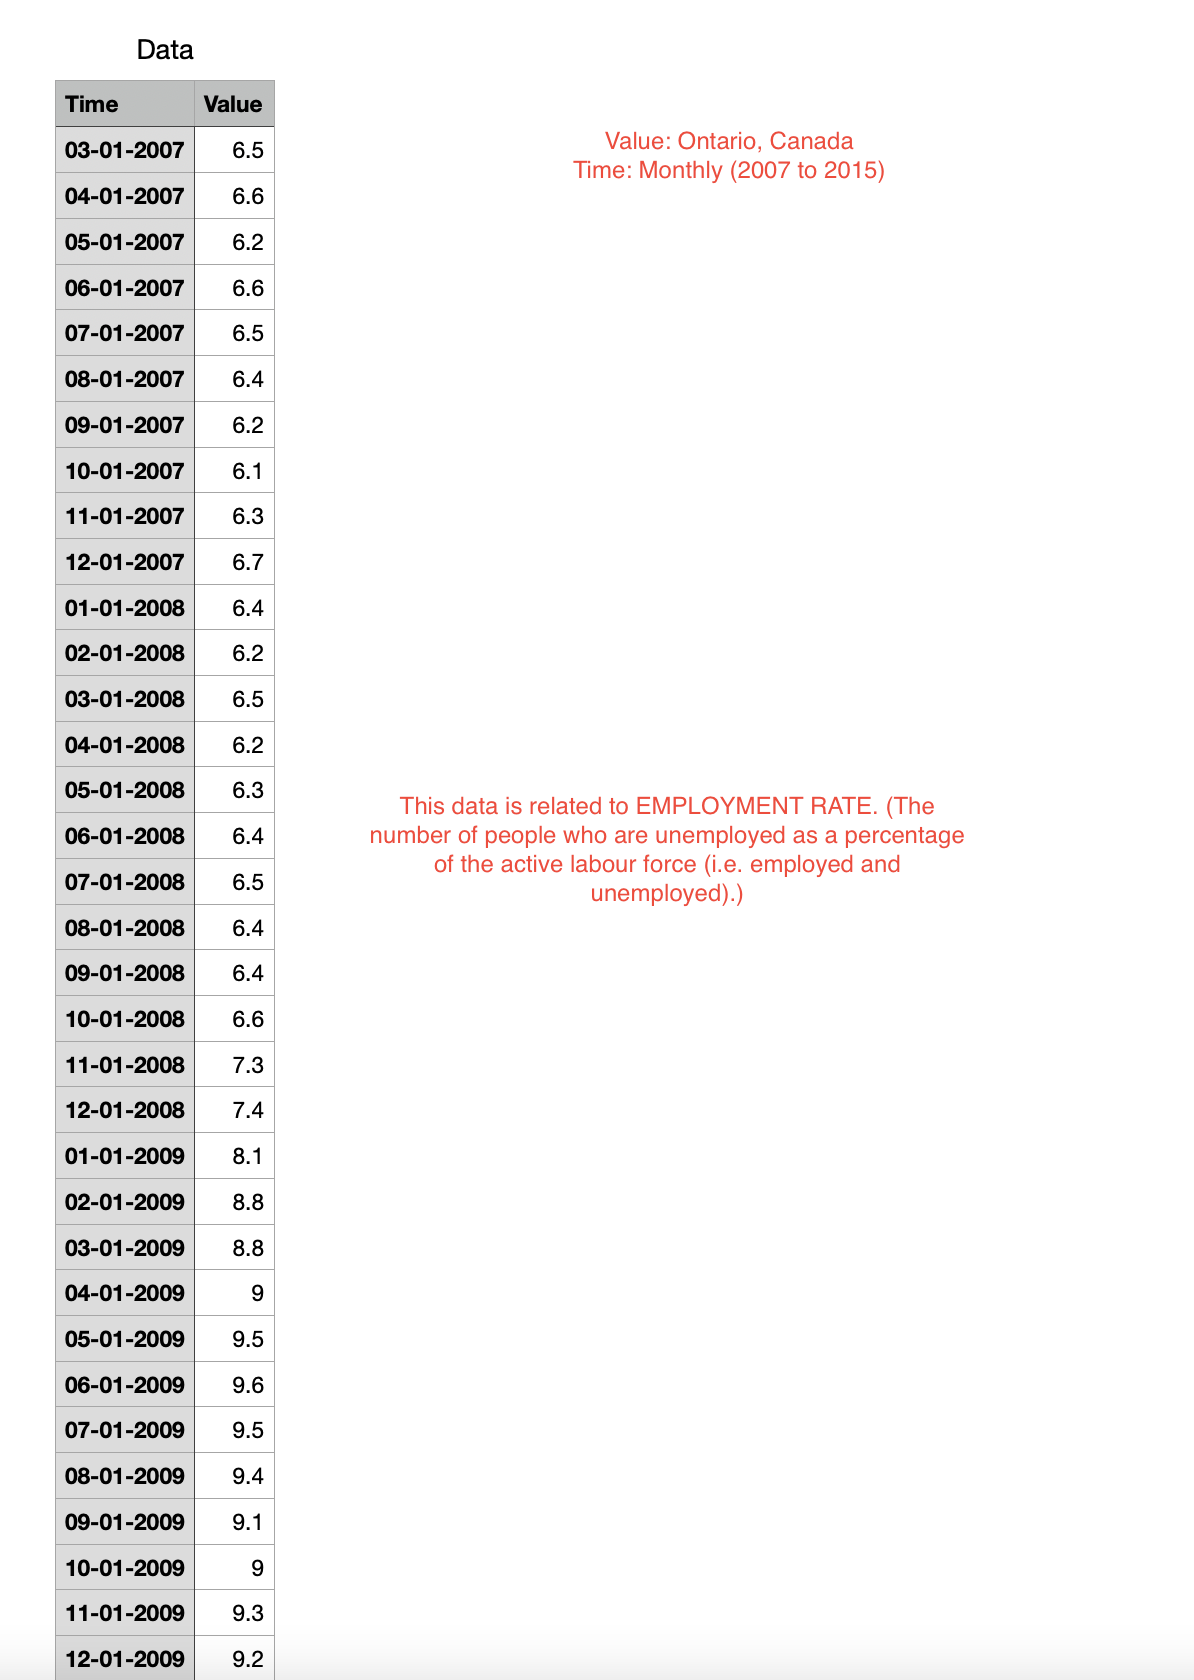
Data Time Value 03-01-2007 6.5 Value: Ontario, Canada Time: Monthly (2007 to 2015) 04-01-2007 6.6 05-01-2007 6.2 06-01-2007 6.6 07-01-2007 6.5 08-01-2007 6.4 09-01-2007 6.2 10-01-2007 6.1 11-01-2007 6.3 12-01-2007 6.7 01-01-2008 6.4 02-01-2008 6.2 03-01-2008 6.5 04-01-2008 6.2 05-01-2008 6.3 This data is related to EMPLOYMENT RATE. (The 06-01-2008 6.4 number of people who are unemployed as a percentage of the active labour force (i.e. employed and 07-01-2008 6.5 unemployed).) 08-01-2008 6.4 09-01-2008 6.4 10-01-2008 6.6 11-01-2008 7.3 12-01-2008 7.4 01-01-2009 8.1 02-01-2009 8.8 03-01-2009 8.8 04-01-2009 9 05-01-2009 9.5 06-01-2009 9.6 07-01-2009 9.5 08-01-2009 9.4 09-01-2009 9.1 10-01-2009 9 11-01-2009 9.3 12-01-2009 9.2Series Data.csv[, "Value"] 1.0 0.8 ACF -0.2 0.0 0.2 0.4 0.6 0 10 15 20 LagTime Time & Value ACF -0.5 0.0 0.5 1.0 -0.5 0.0 0.5 1.0 0 5 10 15 0 5 10 15 Lag Lag Value & Time Value ACF -0.5 0.0 0.5 1.0 -0.5 0.0 0.5 1.0 -15 -10 -5 O 0 5 10 15 Lag Lagtime series data 100 O 0 20 40 60 80 100 Time
Step by Step Solution
There are 3 Steps involved in it

Get step-by-step solutions from verified subject matter experts