

Question: Create a Gantt chart to show an implementation plan forthe followingtransformation initiatives, utilizingthe initiative costs, value, durationsand dependencies as shown: One-Time CostAnnual OpEx Implementation Dependencies
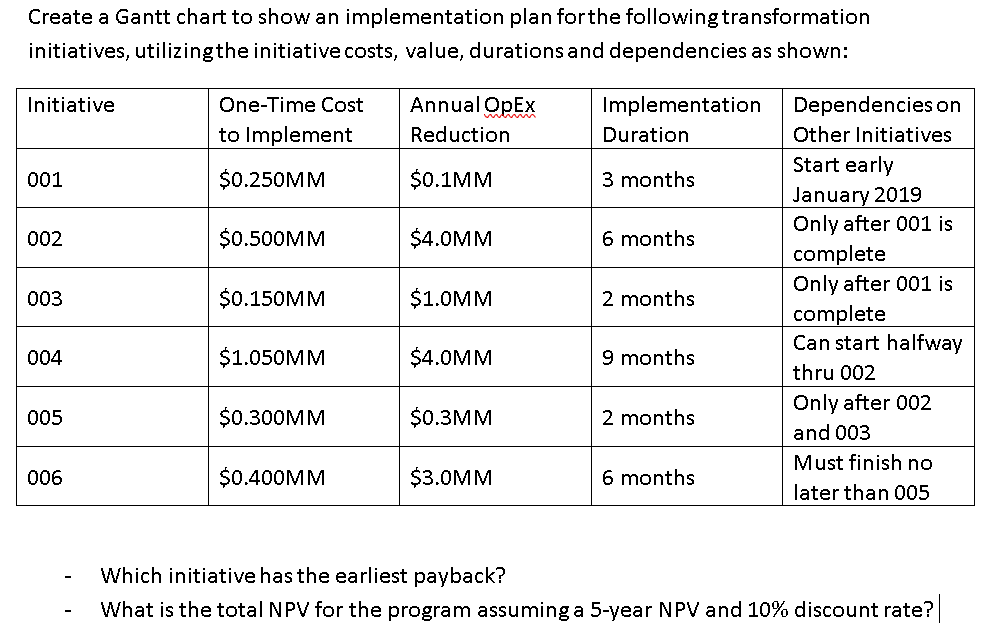
Create a Gantt chart to show an implementation plan forthe followingtransformation initiatives, utilizingthe initiative costs, value, durationsand dependencies as shown: One-Time CostAnnual OpEx Implementation Dependencies on Duration Initiative to lmplement $0.250MNM $0.500MNM $0.150MM $1.050MM 0.300MNM $0.400MNM Reduction $0.1MM $4.0MM $1.0MM $4.0MM $0.3MM $3.0MM Other Initiatives Start early January 2019 Only after 001 is complete Only after 001 is complete Can start halfway thru 002 Only after 002 and 003 Must finish no later than 005 001 3 months 002 6 months 003 004 005 006 2 months 9 months 2 months 6 months Which initiative has the earliest payback? What is the total NPV for the program assuming a 5-year NPV and 10% discount rate
Step by Step Solution
There are 3 Steps involved in it

Get step-by-step solutions from verified subject matter experts