

Question: Create x and y vectors from 5 to +5 with a spacing of 0.5. Use the meshgrid function to map x and y onto
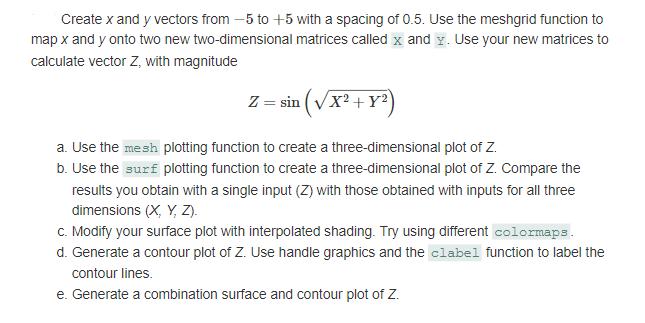
Create x and y vectors from 5 to +5 with a spacing of 0.5. Use the meshgrid function to map x and y onto two new two-dimensional matrices called x and y. Use your new matrices to calculate vector Z, with magnitude Z = sin (X + y) a. Use the mesh plotting function to create a three-dimensional plot of Z. b. Use the surf plotting function to create a three-dimensional plot of Z. Compare the results you obtain with a single input (Z) with those obtained with inputs for all three dimensions (X, Y, Z). c. Modify your surface plot with interpolated shading. Try using different colormaps. d. Generate a contour plot of Z. Use handle graphics and the clabel function to label the contour lines. e. Generate a combination surface and contour plot of Z.
Step by Step Solution
There are 3 Steps involved in it

Get step-by-step solutions from verified subject matter experts