

Question: __________________________________________ D __-______-___--___-__-___-___-__-___--___ Box Piot Based on this Box Plot Graph, answer the following questions: a) What percent of data falls in the interval [5,8]?
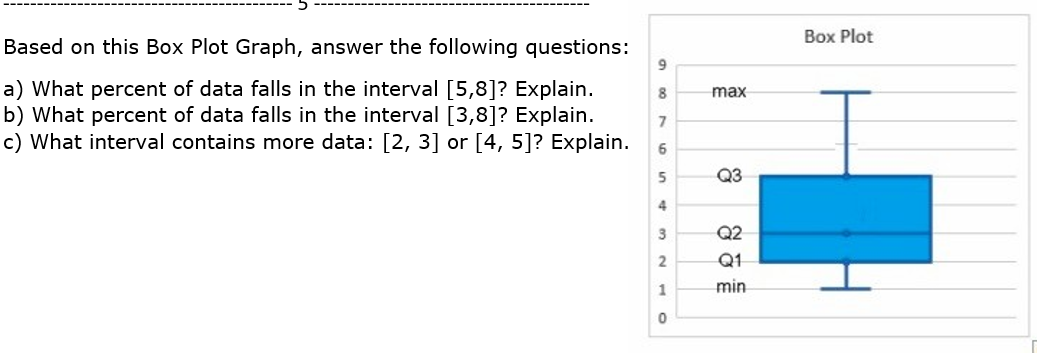
__________________________________________ D __-______-___--___-__-___-___-__-___--___ Box Piot Based on this Box Plot Graph, answer the following questions: a) What percent of data falls in the interval [5,8]? Explain. b) What percent of data falls in the interval [3,8]? Explain. c) What interval contains more data: [2, 3] or [4, 5]? Explain. min Gamma-manna
Step by Step Solution
There are 3 Steps involved in it
1 Expert Approved Answer
Step: 1 Unlock

Question Has Been Solved by an Expert!
Get step-by-step solutions from verified subject matter experts
Step: 2 Unlock
Step: 3 Unlock