

Question: D Graph A Graph B 52 A 51 D D2 D1 Graph C Graph D The figures above illustrate four different markets experiencing changes to
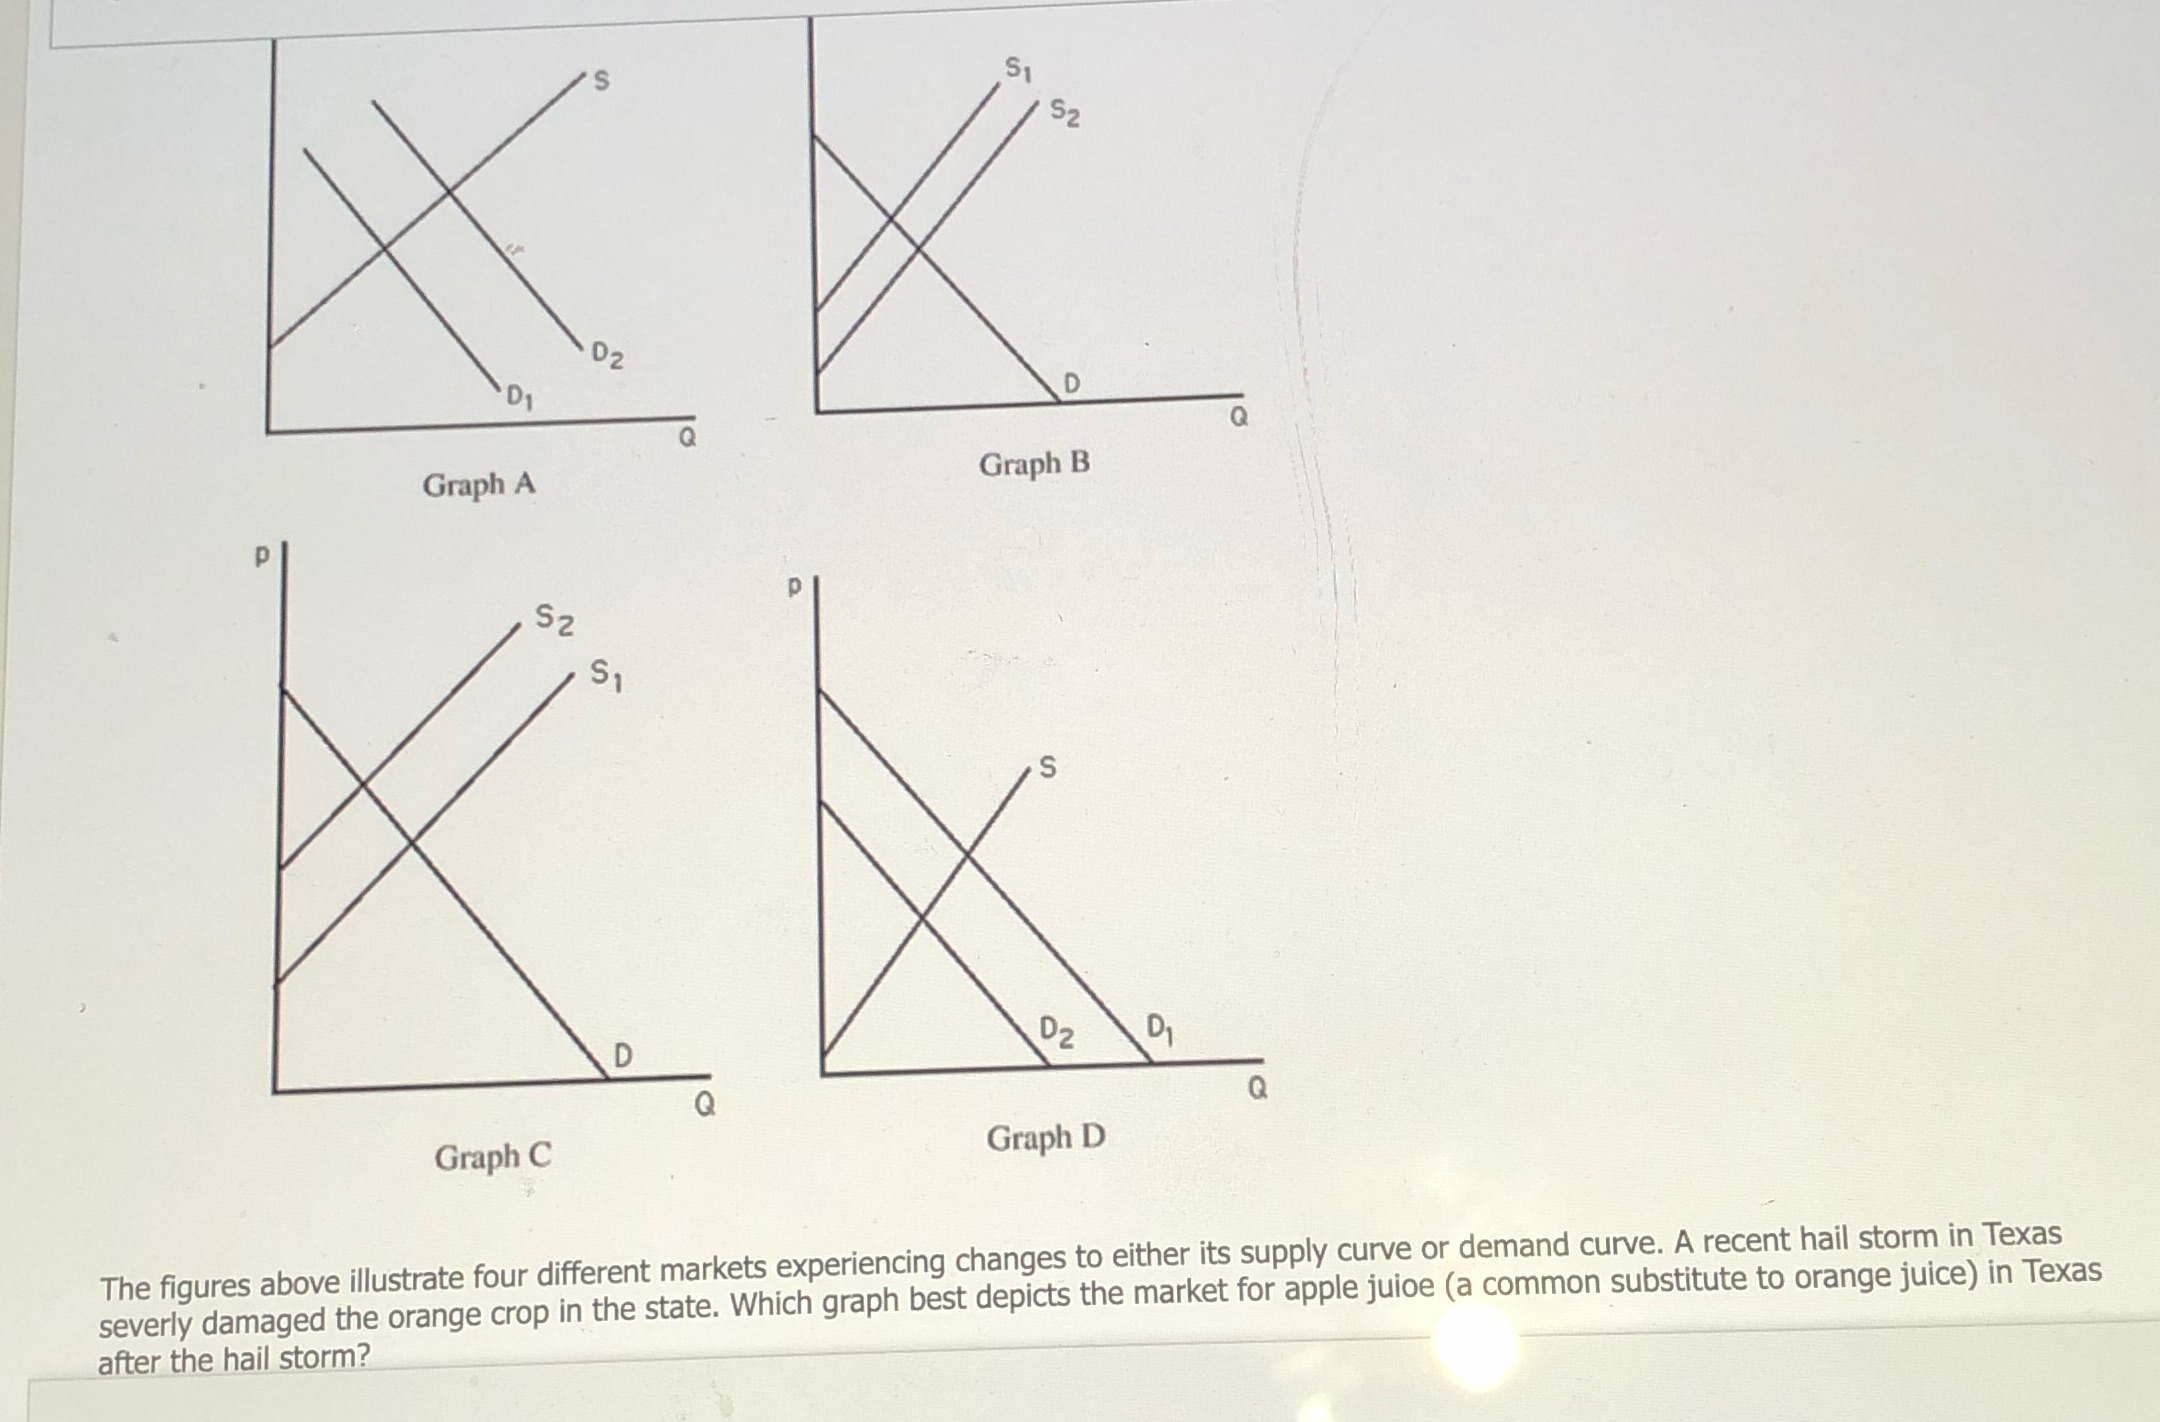
D Graph A Graph B 52 A 51 D D2 D1 Graph C Graph D The figures above illustrate four different markets experiencing changes to either its supply curve or demand curve. A recent hail storm in Texas severly damaged the orange crop in the state. Which graph best depicts the market for apple juice (a common substitute to orange juice) in Texas after the hail storm
Step by Step Solution
There are 3 Steps involved in it
1 Expert Approved Answer
Step: 1 Unlock

Question Has Been Solved by an Expert!
Get step-by-step solutions from verified subject matter experts
Step: 2 Unlock
Step: 3 Unlock