

Question: Data collected on the yearly registrations for a Six Sigma seminar at the Quality College are shown in the following table: 11 2 3 Registrations
Data collected on the yearly registrations for a Six Sigma seminar at the Quality College are shown in the following table: 11 2 3 Registrations (000) 4.00 7.00 4.00 Year a) Calculate the forecasted registrations for years 2 through 12 using exponential smoothing, with a smoothing constant (a) of 0.40 and a starting forecast of 6.00 for year 1 (round your responses to one decimal place). Year Forecast (000) 1 6.00 3 4 5 6 7 8 9 10 4.00 10.00 9.00 7.00 10.00 11.00 16.00 15.00 4 5 6 8 9 11 b) Mean absolute deviation based on the forecast developed using the exponential smoothing method (with a smoothing constant () = 0.40 and a starting forecast of F = 6.00) is registrations (round your response to one decimal place).
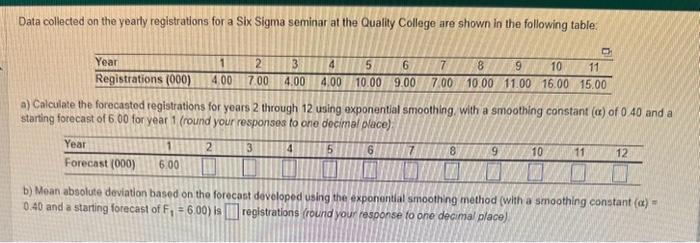
Data collected on the yearly registrations for a Six Sigma seminar at the Quality College are shown in the following table: a) Calculate the forecastod registrations for yoars 2 through 12 using oxponential smoothing. with a smoothing constant () of 0.40 and starting forecast of 6.00 for year 1 (round your responses to one decimal olace). b) Mean absolute deviation based on the forecast devoloped using the exponental smoothing method (with a smoothing constant ()= 0.40 and a starting forecast of F1=6.00 ) is registrations (round your cesponse to one decimal place)
Step by Step Solution
There are 3 Steps involved in it
1 Expert Approved Answer
Step: 1 Unlock

Question Has Been Solved by an Expert!
Get step-by-step solutions from verified subject matter experts
Step: 2 Unlock
Step: 3 Unlock