

Question: Data collected on the yearly registrations for a Six Sigma Seminar at the Quality College are shown in the following table: a) Develop a three-year
Data collected on the yearly registrations for a Six Sigma Seminar at the Quality College are shown in the following table:
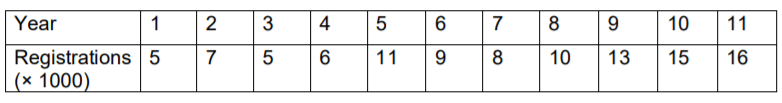
a) Develop a three-year moving average to forecast registrations from year 4 to year 12.
b) Estimate demand again for years 4 to 12 with a three-year weighted moving average in which registrations in the most recent year are given a weight of 2, and registrations in the other two years are each given a weight of 1.
c) Graph the original data and the two forecasts. Which of the two forecasting methods seems better?
Year 1 2 3 4 6 5 6 7 10 11 7 5 6 11 9 10 13 15 16 Registrations 5 (* 1000)Step by Step Solution
There are 3 Steps involved in it
1 Expert Approved Answer
Step: 1 Unlock

Question Has Been Solved by an Expert!
Get step-by-step solutions from verified subject matter experts
Step: 2 Unlock
Step: 3 Unlock