Question: Data Formulas Review View Home Insert Page Layout Store > PivotChart ill. a kl. Recommended Charts Charts My Add-ins 3D Map - Tours Pictures Online
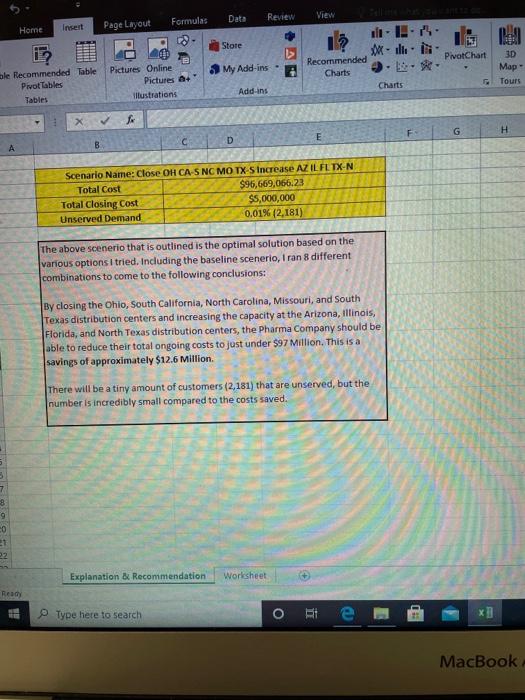
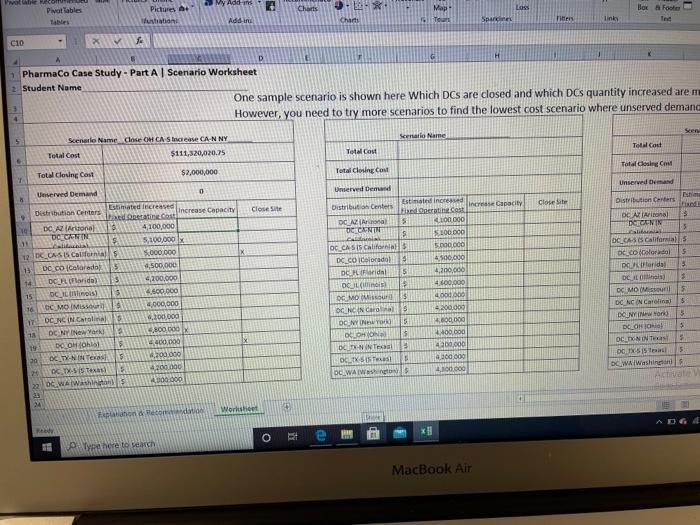
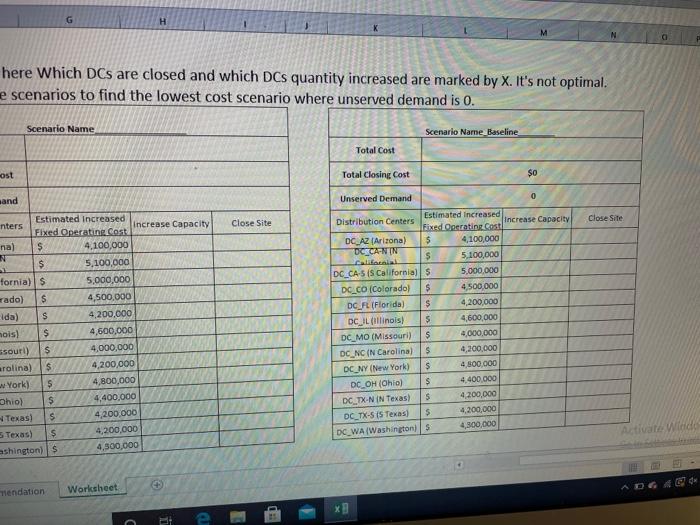
Data Formulas Review View Home Insert Page Layout Store > PivotChart ill. a kl. Recommended Charts Charts My Add-ins 3D Map - Tours Pictures Online Pictures illustrations ble Recommended Table Pivot Tables Tables Add-ins G H F D E B Scenario Name: Close OH CA-SNC MO TX-S Increase AZ ILFL TX-N Total Cost $96,669,066.23 Total Closing Cost $5,000,000 Unserved Demand 0.01% (2,181) The above scenerio that is outlined is the optimal solution based on the various options I tried. Including the baseline scenerio, Iran 8 different combinations to come to the following conclusions: By closing the Ohio, South California, North Carolina, Missouri, and South Texas distribution centers and increasing the capacity at the Arizona, Illinois, Florida, and North Texas distribution centers, the Pharma Company should be able to reduce their total ongoing costs to just under $97 Million. This is a savings of approximately $12.6 Million There will be a tiny amount of customers (2,181) that are unserved, but the number is incredibly small compared to the costs saved. 5 7 3 9 0 31 22 Explanation & Recommendation Worksheet Type here to search O e MacBook Add Pivot Tables Charts Lass Pictures stations Map Toa Box Footer Tee Charts Addin Spuren links Titters C10 A D H PharmaCo Case Study - Part A Scenario Worksheet 2 Student Name One sample scenario is shown here Which DCs are closed and which DCs quantity increased arem However, you need to try more scenarios to find the lowest cost scenario where unserved demand Seen 5 Scenato Name Close ON CA Saceae CA-N NY Selo Name Total cost $111,320,020.75 Tot cost Total Cost Total design $2,000,000 Total Closing Cart Total Closing cost Unserved Closite Distribution Center Close Site DC Arional DEGEN 3 5 Verved Demand 0 Distribution Centers Estimated increased tad ottiecast Increase Capacity DC Arconal $ 4,100,000 DOUCAN $ 5,100,000 x 12 DCCASIS. Californials SOOO.000 DC CO Colorado 4,500,000 14 DCFL (Florida) 13 4200.000 15 Il nous 4.600.000 16 DC MOIMIS 15 4,000,000 12 DCNC INCoins 200.000 DC NY New York 2 100.000 19 DO Ohls 4 30 0 - [N H 5 200.000 24 OCTY-SIST 5 4200 000 22 DC WA Washions 4.000.000 Unserved Demand Distribution Centers Estimated increased In Capacity xed Operatinos! OCAZIA 5 100 000 DE CANTIN $ 10.DOC DCCASIS California 500.000 DC_Colorado 4.500.000 DC adal 5 4,200,000 OCUL 400.000 OG MO Miss 4.000.000 OCLCN Cars 200 000 DOWN 5 4,000 DEMON 5 4400.00 DE TUNINTE > 43 DET SISTE 4 000 000 DCLWAYS 4.100.000 OCCAS California occo Colorado 5 Doridai 5 DE LO DC MO Missouri 5 DCNCN Carolina 5 DON 13 ! $ OCT NON TEN 5 DC WA Washing 24 on decoration Worksheet * o M type here to reach MacBook Air G H N here Which DCs are closed and which DCs quantity increased are marked by X. It's not optimal. e scenarios to find the lowest cost scenario where unserved demand is 0. Scenario Name Scenario Name Baseline Total Cost ost Total Closing Cost $0 and 0 Unserved Demand Close Site Close Site Estimated Increased inters Increase Capacity Fixed Operating cost na) $ 4,100,000 N $ 5,100,000 fornia) 5,000,000 cado) $ 4,500,000 da) S 4,200,000 $ 4,600,000 ssouri) $ 4,000,000 arolina) $ 4,200,000 w York) 5 4,800,000 Ohio) $ 4,400,000 Texas) S 4,200.000 Texas) $ 4,200,000 ashington) 4,500,000 Distribution Centers Estimated increased Fixed Operating cost Increase Capacity DC_AZ (Arizona) $ 4,100,000 DC CA-N IN s 5.100,000 DC_CA-S (S California) 5 5,000,000 DC_CO (Colorado $ 4,500,000 DC (Florida) $ 4,200,000 DC IL (llinois) 5 4,600,000 DC_MO (Missouri) $ 4,000,000 DC_NC ( Carolina $ 4,200,000 DC NY (New York) $ 4.800,000 DC OH (Ohio) $ 4,400.000 DC TX-NIN Texas) 5 4,200,000 DC_TX-5 IS Texas) $ 4,200,000 DC WA (Washington) S 4,300,000 nois) Tendation Worksheet ADI i e Data Formulas Review View Home Insert Page Layout Store > PivotChart ill. a kl. Recommended Charts Charts My Add-ins 3D Map - Tours Pictures Online Pictures illustrations ble Recommended Table Pivot Tables Tables Add-ins G H F D E B Scenario Name: Close OH CA-SNC MO TX-S Increase AZ ILFL TX-N Total Cost $96,669,066.23 Total Closing Cost $5,000,000 Unserved Demand 0.01% (2,181) The above scenerio that is outlined is the optimal solution based on the various options I tried. Including the baseline scenerio, Iran 8 different combinations to come to the following conclusions: By closing the Ohio, South California, North Carolina, Missouri, and South Texas distribution centers and increasing the capacity at the Arizona, Illinois, Florida, and North Texas distribution centers, the Pharma Company should be able to reduce their total ongoing costs to just under $97 Million. This is a savings of approximately $12.6 Million There will be a tiny amount of customers (2,181) that are unserved, but the number is incredibly small compared to the costs saved. 5 7 3 9 0 31 22 Explanation & Recommendation Worksheet Type here to search O e MacBook Add Pivot Tables Charts Lass Pictures stations Map Toa Box Footer Tee Charts Addin Spuren links Titters C10 A D H PharmaCo Case Study - Part A Scenario Worksheet 2 Student Name One sample scenario is shown here Which DCs are closed and which DCs quantity increased arem However, you need to try more scenarios to find the lowest cost scenario where unserved demand Seen 5 Scenato Name Close ON CA Saceae CA-N NY Selo Name Total cost $111,320,020.75 Tot cost Total Cost Total design $2,000,000 Total Closing Cart Total Closing cost Unserved Closite Distribution Center Close Site DC Arional DEGEN 3 5 Verved Demand 0 Distribution Centers Estimated increased tad ottiecast Increase Capacity DC Arconal $ 4,100,000 DOUCAN $ 5,100,000 x 12 DCCASIS. Californials SOOO.000 DC CO Colorado 4,500,000 14 DCFL (Florida) 13 4200.000 15 Il nous 4.600.000 16 DC MOIMIS 15 4,000,000 12 DCNC INCoins 200.000 DC NY New York 2 100.000 19 DO Ohls 4 30 0 - [N H 5 200.000 24 OCTY-SIST 5 4200 000 22 DC WA Washions 4.000.000 Unserved Demand Distribution Centers Estimated increased In Capacity xed Operatinos! OCAZIA 5 100 000 DE CANTIN $ 10.DOC DCCASIS California 500.000 DC_Colorado 4.500.000 DC adal 5 4,200,000 OCUL 400.000 OG MO Miss 4.000.000 OCLCN Cars 200 000 DOWN 5 4,000 DEMON 5 4400.00 DE TUNINTE > 43 DET SISTE 4 000 000 DCLWAYS 4.100.000 OCCAS California occo Colorado 5 Doridai 5 DE LO DC MO Missouri 5 DCNCN Carolina 5 DON 13 ! $ OCT NON TEN 5 DC WA Washing 24 on decoration Worksheet * o M type here to reach MacBook Air G H N here Which DCs are closed and which DCs quantity increased are marked by X. It's not optimal. e scenarios to find the lowest cost scenario where unserved demand is 0. Scenario Name Scenario Name Baseline Total Cost ost Total Closing Cost $0 and 0 Unserved Demand Close Site Close Site Estimated Increased inters Increase Capacity Fixed Operating cost na) $ 4,100,000 N $ 5,100,000 fornia) 5,000,000 cado) $ 4,500,000 da) S 4,200,000 $ 4,600,000 ssouri) $ 4,000,000 arolina) $ 4,200,000 w York) 5 4,800,000 Ohio) $ 4,400,000 Texas) S 4,200.000 Texas) $ 4,200,000 ashington) 4,500,000 Distribution Centers Estimated increased Fixed Operating cost Increase Capacity DC_AZ (Arizona) $ 4,100,000 DC CA-N IN s 5.100,000 DC_CA-S (S California) 5 5,000,000 DC_CO (Colorado $ 4,500,000 DC (Florida) $ 4,200,000 DC IL (llinois) 5 4,600,000 DC_MO (Missouri) $ 4,000,000 DC_NC ( Carolina $ 4,200,000 DC NY (New York) $ 4.800,000 DC OH (Ohio) $ 4,400.000 DC TX-NIN Texas) 5 4,200,000 DC_TX-5 IS Texas) $ 4,200,000 DC WA (Washington) S 4,300,000 nois) Tendation Worksheet ADI i e